1. Introduction
he static essay, serving to determine the ultimate resistance to break, may be considered as a very particular case of a essay of fatigue, the number of cycles with break was equal at the most to 1. This ultimate resistance with break is the minimal value in which the break of the material occurs in a certain way.
The problem of dispersal of the trial results, as well in statics (for the determination of the ultimate resistance with break) that in fatigue (for the determination of the number of cycles with break or for the determination endurance limit) is the consequence of the structural heterogeneity of the defects since the elaboration of material [1]- [11]. The density of these defects vary from specimen to another, yet all taken from the same sample. In the case of fatigue, for a given stress level ? i , one can also observe a dispersion value of the number of cycles to failure N i [12]- [13]. The number of cycles to failure is related to the material structure and thus the defects that contain. That these defects are difficult to measure, it is advisable to use as a random variable [12], for a given stress level, the number of cycles to failure to explain the existence of defects by a probabilistic approach. We rely on the concept of the "weakest link" Weibull to formulate a new expression of the SN curve can take into account the actual volume of a flawless material considered. In the absence of a means of assessing defect in the structure, the results for two types of materials are comparable with those of Wöhler and Basquin. A simulation made by the variation of the tensile strength of a material that shows this new expression for describing the fatigue behavior of a hardened material.
2. II.
3. Concept of "Weakest Link" Weibull
According to this concept, for juxtaposed volumes, subjected to monotonic loading, the failure of one is independent of the other, if one of the volumes fails, the system is considered failed [14]. The survival probability of a system consisting of n elements (or volume) is given by: R n =1-e -? fdv (
Where f is the probability density of failure and dv is the elementary volume constituting the reference volume V.
4. III.
5. Specification of the Probability Density Function f
We will consider as a random variable the number of cycles to failure for a given stress level by the fact that the number of cycles determines the fatigue. Dependent on the dispersion, the number of cycles is a variable representing statistically the stress applied from the viewpoint fatigue (damage to a given level of stress). We will consider the failure probability density f as a function of number of cycles to failure; it is given in the following form:
f(N) = ?N m (2)Where ? is a parameter to be determined, and the module m, within the meaning of Weibull [14].
The parameter ? can be determined when we know a characteristic value of the number of cycles N c to a level corresponding stress. At this number of cycles N c characteristic density of default probability take the value 1. It then pulls:
?=N c -m (3) or, f(N)= ? N N c ? m (4)6. T
In this case, the probability of survival given equation ( 1) becomes:
R n =1-e -?? N N c ? m .dv (5)IV.
7. Proposal for a New Expression of the S-N Curve
It is obvious that there is a relationship between the probability of failure P (function the number of cycles) and the level of responsible of this fatigue failure stress. We admit that there is a function g dependent on the characteristics of fatigue ? D and static R m linking the probability of failure P stress responsible for this failure.
Since ? D and R m are constants for a given material, then g is a constant function. A simple relation linking the stress at failure probability is that the stress is proportional to the probability of failure; with as the proportionality coefficient function g. This relationship is expressed by :
?=g?? D ,R m ?P(N) =g?? D ,R m ??1-R(N)? (6) ie, from (5): ?=g?? D ,R m ?e -?? N N c ? m.dv (7) For a tension loading when the load is uniform, the expression (7) becomes :
?=g?? D ,R m ?e -V? N N c ? m (8)Thus, two limiting cases are possible according to the value of the stress ?:
? For ? = R m , ultimate resistance to break, N = 0, the relation (8) becomes:
R m =g?? D ,R m ?(9)? For ? = s D , endurance limit, N = N D , the relation ( 8) becomes :
? D =g?? D ,R m ?e -V? N D N c ? m (10) ie, g?? D ,R m ?=? D e V? N D N c ? m (11)The equality of two expressions g, given by equations ( 9) and (11) gives R m depending on
? D R m =? D e V? N D N c ? m (12)The expression of the S-N curve in tension given by equation ( 8) becomes :
? ? ? ? ? ?=R m e -V? N N c ? m ie ?=? D e V?? N D N c ? m -? N N c ? m ? (13) V.8. Experimental Study of the New Expression
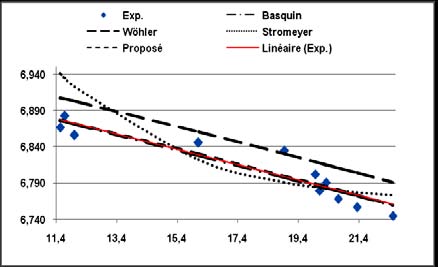
To validate the sensitivity of the proposed fatigue behavior of a material model for V = 1, we have experimental data from two types of materials: steel martensite P220 and 100C6. A comparative study is made, from these data, with models of the most utilized S-N curves [15]- [16] such that Basquin, the Wöhler and the Stromeyer :
? ? ? ? ? log(N) =-a B log(?)+b B : Basquin log(N) =-a W ? +b W : Wöhler log(N) =-a S log(?-? D )+b S : Stromeyer log(N)=a N log ?log ? R m ? ?? +b N : proposed(14)Where, for the proposed model
? a N = 1 m b N =log(N C )The curves parameters are determined for each fatigue testing each of the two steels result, by the method of least square.
9. a) Test Data i. P220 Steel
The data are taken from the steel work performed LaMI (Laboratory of Mechanics and Engineering) in order to investigate the influence of cutting processes on the fatigue behavior of parts. Two procedures were used, laser and shears, it, with several execution qualities (good, standard and bad) corresponding to different sets of machines settings. The tableaux.2 and 3 below give, respectively, the chemical composition and the fatigue test result of the 100C6 steel [11]. The value of the ultimate resistance to break R m of the steel P220 is between 600 and 800 MPa, it will take three values in this range for the simulation thus allowing to highlight the sensitivity of the proposed model.
10. b) Comparison
The comparison will be made by tracing curves in the plane (log (?), log (N))). Parameter values, determined by the method of least squares, corresponding to different models, given by Equations ( 14), for the two steels, are given in the following Table
11. Conclusion
The sensitivity of the proposed model to the values of R m , is reflected in an angular shift in direction of rotation hands of a watch while R m increases (figure.2). The limit of D fatigue increases substantially, but the value of the number of cycles N c dimunie characteristic significantly well as the modulus value m while R m increases, the appreciable increase in the endurance limit with that of the breaking strength reflecting the inflection the S-N curve traced in the plane ( ; N), thus modifying the scope of limited field of fatigue.
The proposed model introduces a new parameter, the number of cycles characteristic N c for which the failure probability density function takes the value 1and therefore the smallest number of cycles which the rupture occurs with certainty. It takes also into account the volume of the material. All the calculations are done by taking V=1. To take into account the defects can be considered as a fraction V corresponds to useful volume of the material constituting the piece to explain the variations of cycles number to failure for a given level of stress. The model allows, given its sensitivity to the change R m , to track the fatigue behavior of work hardened materials, a phenomenon for which the value of its breaking strength R m varies notably.
VIII.

| the standard laser process result | ||||||||||||||||
| Material: P220 | ||||||||||||||||
| Type of sollicitation: tension-compression at constant amplitude | ||||||||||||||||
| Solicitation frequency: 20Hz | ||||||||||||||||
| Dimensions and shape of the specimen | ||||||||||||||||
| ? | (MPa) | 344 | 321,8 | 319,9 | 319,8 | 311,5 | 311,1 | 310 | 309,5 | 290 | 280 | 275 | 270 | 235 | ||
| N | 10596,5 | 296828 | 281248 | 320467 | 371162 | 305503 | 204238 | 309191 | 520089 | 662397 | 3909947 | 5335707 | (*) | 7522596 | (*) | |
| (*) no rupture | ||||||||||||||||
| ii. Martensite Steel 100C6 | ||||||||||||||||
| Martensite steel 100C6 | ||||||||
| Si | Mn | P | S | Cr | Cu | Ni | Mo | O |
| 0,242 | 0,339 | 0,012 | 0,008 | 1,461 | - | 0,147 | 0,032 | - |
| Matereal: martensite steel 100C6 (E=210GPa, R m =2300MPa, ? D =850MPa et N D =6.0265x10 9 cycles). | ||||||||||||
| Solicitation frequency: 20KHz | ||||||||||||
| Fatigue test results | ||||||||||||
| ? | (MPa) | 975 | 960 | 950 | 940 | 930 | 900 | 890 | 880 | 870 | 860 | 850 |
| Nmoy. | x10 6 | 0,1183 | 0,1019 | 0,1639 | 9,806 | 167 | 466 | 664,4 | 542,1 | 990,75 | 1853,3 | 6026,5 |