1. Introduction
ost recently, in its "Tropical Cyclone Wind Exposure Documentation Project", the Hurricane Research Division (HRD) at the Atlantic Oceanographic and Meteorological Laboratory (AOML), U. S. National Oceanic and Atmospheric Administration (NOAA), has made an extensive survey and monitoring of the roughness length (Zo) at 213 ASOS are located at hurricane-prone airports (see www.aoml.noaa.gov/hrd/asos/index.html). Because Zo is a parameter needed for wind and turbulence estimates for civil, structural and environmental engineers (see, e.g., Hsu, 2013), the purpose of this study is to utilize these newly available Zo measurements by AOML for engineering applications.
2. II.
3. Geometric Mean zo for each ASOS Environment
According to AOML the 360 degree compass for the wind direction measurement is divided into 8 segments
Author: Professor Emeritus and Certified Consulting Meteorologist Coastal Studies Institute, Louisiana State University. e-mail: [email protected] so that there is one Zo value for each 45 degrees at each ASOS. These 8 Zo values may be needed for aviation safety reasons. However, since the wind direction in a tropical cyclone is rotational in nature and since the strongest wind may come from any direction, it is not necessary for practical operation to have 8 Zo for each ASOS. Instead, a typical Zo value or the geometric mean for each ASOS is needed for most engineering applications. Therefore, the original list which consists of 8 Zo values for each ASOS is geometric averaged. Our results are provided in the Appendix with one geometric mean Zo for each of the 213 ASOS.
4. III.
Validating the Relation between zo, Gust Factor and Turbulence Intensity
According to Panofsky and Dutton (1984, pp.130-131), it is common in engineering practice to describe the variation of the wind speed with height, i.e. the wind profile with a power law such that
Where U 2 and U 1 are the wind speed at height Z 2 and Z 1 Now, for each ASOS Station the appropriate value of p based on Eq. ( 2) is also provided in the Appendix.
, respectively, p is the power-law exponent, and Zo is the roughness length.
According to Hsu (2013), for 5 second gust over the 2 minute duration, which is available routinely from the wind speed measurements by ASOS, we have
G = 1 + 2.04 P (3) = 1 + 2.04 TI (4)Where G is the gust factor (the ratio of 5-s gust to 2 -min sustained wind speed) and TI represents the longitudinal turbulence intensity. A forementioned equations are validated as follows :
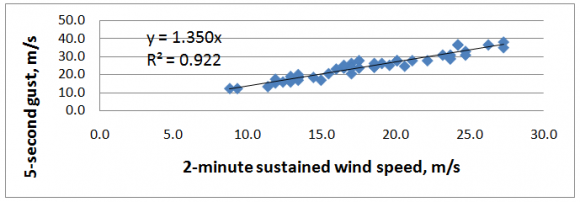
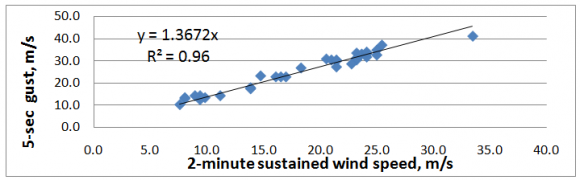
wind speed measurements. According to U. S. National Data Buoy Office (see http://www.ndbc.noaa.gov/rsa. shtml), The composite accuracy of field measurements for the wind speed and wind gust is +/-10 %. In other words, if the difference between measurements and estimates related to wind and gust characteristics is within 10 %, one may accept those estimates as reasonable. Note that this 10 % margin of error can also be related to the different anemometers used in the field. An example is shown in Table 1. On the basis of Tables 2 and 3 and Fig. 1, we can say that the geometric mean Zo for KILM as listed in the Appendix is valid for engineering applications. Furthermore, it is shown that p =TI. (Data Source : Schroeder, 1999). In 2005 Hurricane Rita passed near Lake Charles, Louisiana, USA. On the basis of Fig. 2 and Eq.
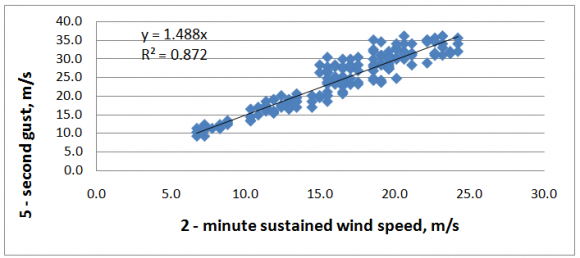
(3), P = 0.172. According to the Appendix for KLCH, p = 0.182. Since the difference between these two p values is 5.5 %, we can say that the mean geometric Zo value and the computed p value are validated. 1), we have p = 0.2996. Since the difference between 0.29 and 0.2996 is approximately 3 %, we can say that Eq. ( 1) is further verified. Now, according to Fig. 3 and Eq. ( 3), p = 0.180. Since this value is nearly equal to that of 0.177for KHOU as shown in the Appendix, we can say that the geometric mean Zo for KHOU is validated. Since the information on both 3-second and peak gusts are needed for wind load analyses (see, e.g., Irwin, 2006) and since some data during Katrina are available, we can use Katrina as a case study. This is done as follows : According to the Hurricane Katrina Post-Tropical Cyclone Report (http://www.srh.noaa.gov/lix/? n=psh_katrina) by the National Weather Service (NWS) in New Orleans,LA, there was an ASOS station located at 50 feet (or 15.2 m) over Lake Pontchartrain. That station recorded max 2-min sustained wind speed of 68 knots (35.1 m/s) and 5-second gust of 86 knots (44.3 m/s). Therefore, according to Eq. ( 3), p = 0.130. According to Hsu (2013) and Fig. 6, the gradient height over the Lake was 309 m so that the wind speed at 309 m is estimated to be
U 309m = U 15.2mNow, according to the Appendix, p = 0.225 for New Orleans International Airport (KMSY). Substituting gradient height over KMSY is estimated to be 467m. Therefore, based on Eq. ( 6), the 2-minute sustained wind speed over KMSY at the elevation of 467m was 51.9 m/s during Katrina. Although much of the data were not available due power failure during Katrina, there were two peak wind speed measurements located at
International Airport during Katrina as provided in the website as quoted above. This is done in Table 4.Since the difference between estimated and measured is 5.5 % or less, the methods provided in this study should be useful in engineering applications. 9), we have max This estimated value is in good agreement with those measured value which ranged from 53.6 to 55.2 m/s or from 104 to 107 knots. Therefore, the answer to the questions raised by the civil and structural engineers is that those "peak gust" measurements in the Eastern New Orleans area as provided in its Hurricane Katrina -Post Tropical Cyclone Report by the National Weather Service in New Orleans were in fact not the 3-second gust but the maximum instantaneous gust, which represents the 3 standard deviation or within the top 1 % probability.
=33.3*(1+3*0.198)=53.0 m/s=103 knot (10) c) Application to estimate peak factor Depending on anemometer system and averaging period, each dataset for the wind speed measurement consists of the duration of sampling such as 1 minute (e.g. see Table 2), 2 minutes (such as from ASOS station),10 minutes, or even one hour. Within this sampling duration, there is a maximum or peak gust, which represents the shortest period of measurement such as 0.2 second as shown in Table 2. Therefore, the generic formula similar to Eq. ( 9) is
U peak = U duration Or, A = (U (1+ A p) (11) peak /U durationWhere "A" is the peak factor.
-1)/ p (12
)An example is provided as follows: According to Table 2, the maximum 1-min wind speed was 25.0 m/s and the max 0.2-second 38.2 m/s.
A question was raised by some civil and According to Table 1, p= 0.185, substituting these values into Eq. ( 12), we get A = 2.85. Since the difference between 2.85 and 3 (see Eq. 3) is 5 %, we can say that the 0.2-second gust measurement is near the top one per cent during a one minute period. Statistically, one can also get this "A" value from the ratio of 0.2 second and one minute such that 0.2/60 = 0.0033 or within the top 1 % probability. Furthermore, from statistics (see, e.g., Spiegel, 1961, p.343), (1-0.2/60)/2 = 0.4983 so that "A" = 2.93 for areas under standard normal curve from zero to z, where z is our peak factor. Note that this value of 2.93 is even closer to 3 as shown in Eq. ( 9).
V.
5. Conclusions
On the basis of aforementioned analyses and discussions, several conclusions may be drawn: 1. Because of the instrument response and system design the composite accuracy of the anemometer for field application is illustrated to be approximately within 10 %. 2. The roughness length (Zo) measurements around the 360 compass in each of the 213 ASOS stations located in tropical-cyclone prone regions have been averaged geometrically. Appendix : A list of geometric mean for Zo and power-law exponent for p.
6. Station

| b) Validation during Hurricane Bonnie in 1998 | |||
| turbulence intensity (TI) from different anemometers | |||
| during Hurricane Bonnie in 1998 | |||
| (1). UVW | (2). Propeller- | Difference | Mean TI |
| anemometer | Vane | between | between |
| anemometer | (1) and (2) | (1) and (2) | |
| 0.175 | 0.195 | 10 % | 0.185 |
| (Data source: Schroeder, 1999) | |||
| ASOS and Texas Tech University at Wilmington Airport | ||
| (KILM), North Carolina, USA, during Hurricane Bonnie in | ||
| 1998 | ||
| ASOS | Texas Tech | |
| Station | Station | |
| 0.2-Second Gust (m/s) | NA | 38.2 |
| 3-Second Gust (m/s) | NA | 33.6 |
| 5-Second Gust (m/s) | 32.9 | 33.5 |
| 1-minute Sustained (m/s) | NA | 25.0 |
| 2-minute Sustained (m/s) | 25.2 | 24.4 |
| 25.00 30.00 35.00 | R² = 0.920 y = 1.420x | |||||||
| 20.00 | ||||||||
| 15.00 | ||||||||
| 10.00 | ||||||||
| 5.00 | ||||||||
| 0.00 | ||||||||
| 0.00 | 5.00 | 10.00 | 15.00 | 20.00 | 25.00 | |||
| 5 | ||||||||
| : A comparison of measurements against 3 | ||||||||
| estimates of p using Eq. (3) and the geometric mean of | ||||||||
| Zo from Appendix at Wilmington Airport during | ||||||||
| Hurricane Bonnie in 1998 | ||||||||
| Source | (1). P based | (2). P from | Difference | (68.4/47) = (350/77) ^ p | ||||
| on either | Appendix | between | So that p = Ln (68.4/47)/Ln (350/77) = 0.248 | (5) | ||||
| UVW, Table 1 Pro peller-vane, Table 1 | measured or estimated 0.175 0.195 | for KILM 0.185 0.185 | (1) and (2) 0.054 0.051 | Since this value is identical to that at KASD for Slidell Airport, LA (which is not very far from Pass Christian), as provided in the Appendix, we can say that the geometric mean Zo for KASD is verified for practical | ||||
| ASOS, Table 2 | 0.150 | 0.185 | 0.189 | use. Note that, during Katrina, nearly all surface wind | ||||
| TTU, Table 2 | 0.183 | 0.185 | 0.011 | |||||
| Fig. 1 | 0.206 | 0.185 | 0.102 | |||||
| Mean | 0.182 | 0.185 | 0.016 | |||||
| c) Validation during Hurricane Katrina in 2005 | ||||||||
| Engineering Applications of the Newly Available Roughness-Length Measurements by AOML at 213ASOS | |
| Stations | |
| Year 2013 | |
| 14 | |
| rsion I | |
| XIII Issue v VII Ve | |
| Volume | |
| D D D D ) E | |
| ( | |
| Global Journal of Researches in Engineering | coming ashore near Pass Christian, MS, the aircraft measure-ments of maximum wind speed was 68.4 m/s at 350 m and at the near-surface (77m) it dropped down to 47 m/s. Therefore, according to Eq. (1), we have |
| measurements were not available because of massive | |
| power failure. Therefore, these aircraft measurements by | |
| U.S. Air Force Hurricane-Hunters are greatly | |
| appreciated. | |
| d) Validation during Hurricane Rita in 2005 | |
| According to Henning (see http://ams.confex.- | |
| com/ams /pdfpapers/108816.pdf), when Katrina was | |
| second gust around New Orleans International Airport | |||
| during Katrina | |||
| Height, | Estimated, | Measured, | Difference |
| m | m/s | m/s | In per cent |
| 36.6 | 42.7 | 43.8 | 2.5 % |
| from Eq.(7) | From NWS | ||
| 9.1 | 31.2 | 33.0 | 5.5 % |
| From Eq.(8) | From NWS | ||