1. INTRODUCTION
agnetic resonance imaging (MRI) is a medical imaging technique that measures the response of atomic nuclei of body tissues to high frequency radio waves when placed in a strong magnetic field and that produces images of the internal organs. Magnetic Resonance Imaging has proven to be particularly valuable for examination of the soft tissues in the body and is a commonly used form of medical imaging. Because of the resolution of MRI and the technology being essentially harmless it has emerged as the most accurate and desirable imaging technology. It was shown that pure noise in MR magnitude images could be modeled as a Rayleigh distribution. Afterwards, the Rician model was proposed as a more general model of noise in MR images. Sources of MR noise include thermal noise, inductive losses, sample resolution, and field-of-view. Despite significant improvements in recent years, magnetic resonance images often suffer from low SNR especially in cardiac and brain imaging. Therefore, noise reduction techniques are of great interest in MR imaging.
2. II.
3. RELATED WORK
The image processing literature presents a variety of de-noising methods. Many of the popular de-noising algorithms suggested are based on wavelet thresholding [1]- [4]. These approaches attempt to separate significant features from noise in the frequency domain and simultaneously preserve them while removing noise. If the wavelet transform is applied on MR magnitude data directly, both the wavelet and the scaling coefficients of a noisy MRI image become biased estimates of their noise-free counterparts. Therefore, it was suggested [2] that the application of the wavelet transform on squared MR magnitude image data would result in the wavelet coefficients no longer being biased estimates of their noise-free counterparts. Although the bias still remains in the scaling coefficients, it is not signal-dependent and can therefore be easily removed. The difficulty with wavelet or anisotropic diffusion algorithms is again the risk of over smoothing fine details particularly in low SNR images [5]. From these points, it is understood that all the algorithms have the drawback of over-smoothing fine details. In [6], stated that oscillatory functions or oriented textures have a significantly sparser expansion in wave atoms than in other fixed standard representations like Gabor filters, wavelets and curvelets. In [7], denoising using Wave Atom is done by estimating the noise variance by trial and error method. In [8], denoising using Wave Atom is done by estimating the noise variance by histogram technique.
4. III.
5. RICIAN NOISE
Magnetic resonance magnitude image data are usually modelled by the Rician distribution [9]. The magnetic resonance signals are acquired in quadrature channels. Each signal produces an image that is degraded by a zero-mean Gaussian noise of standard deviation as 0. The two images are then combined into a magnitude image and the Gaussian noise PDF is transformed into a Rician noise PDF. The joint probability density of the noise from two quadrature channels can be expressed as [10]:
2 0 2 2 2 0 2 exp 2 1 , i r i r n n n n p (1)The expectation values for the mean magnitude and the variance are [2]:
4 exp 2 I 2 0 2 0 X 2 0 4 2 1 2 0 2 2 2 0 4 2 0 2 0 2 2 1 X I X X I X (2) M Global Journal of Researches in Engineering Volume XII Issue v v v v IV Version I 23 ( D D D D ) F © 2012 Global Journals Inc. (US) 2 0 2 2 exp 2 2 0 2 0 2 2 2 X X I 2012 March Geetika Dua & Varun Raj Author :ECE Deptt., GGSIPU Delhi. E-mail : [email protected] 2 2 0 4 2 1 2 0 2 2 2 0 4 2 0 2 0 2 2 1 X I X X I X (3)where 0 I and 1 I are modified Bessel functions of the first kind and X denotes the MR magnitude image.
IV.
6. WAVEATOM TRANSFORM
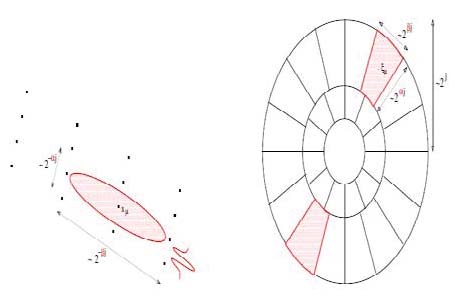
Wavelet transform is a well known multiresolution analysis tool capable of conveying accurate temporal and spatial information. Wavelets better represent objects with point singularities in 1D and 2D space but fail to deal with singularities along curves in 2D. Therefore wavelet representation does not offer sufficient sparseness for image analysis. Following the introduction of wavelet transform, research community has witnessed intense efforts for development of wave atoms, ridgelets [11], contourlets [12] and curvelets [13]. These tools have better directional and decomposition capabilities than wavelets. Wave atoms have a sharp frequency localization that cannot be achieved using a filter bank based on wavelet packets and offer a significantly sparser expansion for oscillatory functions [14]. Wave atoms capture coherence of pattern across and along oscillations whereas curvelets capture coherence only along oscillations. To make our discussion concrete, we need to classify various wave-packet transforms as phase-space tilings. Since a complete collection must span all positions and frequencies, we see that wave packets are actually tiles in phase-space. We say a tiling is universal if it treats democratically all positions and orientations as shown in Figure 1. Two parameters should suffice to index a lot of known wave packet architectures: to index whether the decomposition is multiscale ( = 1) or not ( = 0); and to indicate whether basis elements are localized and poorly directional ( = 1) or, on the contrary, extended and fully directional ( = 0). Wave Atoms corresponds to = =1/2, having an aspect ratio ~2-j/2 ×2 -j/2 in space, with oscillations of wavelength~2 -j in the codirection .
Wave atoms are a variant of 2D wavelet packets which obey the parabolic scaling law: wavelength~(diameter) 2 .
V.
7. EXPERIMENTS AND RESULTS
This section gives a detailed analysis of the proposed MRI de-noising algorithm. It compares and validates the performance of the proposed method using simulated and Real MR images and also compares the performance of the proposed method with Wavelet shrinkage.
Determination of threshold is very critical in this work. Input elements with absolute value greater than the set threshold value, are set to 1. In this work a new threshold is proposed which is better as compared to old threshold [15].
Old Threshold is given as: val val min max ln
After applying threshold criterion inverse Wave Atom transform and inverse Wavelet transform is applied separately and performance of both is compared using four comparison parameters.
Four comparison parameters mean square error (MSE), peak signal to noise ratio (PSNR), signal to mean square error (S/MSE) and signal to noise ration(SNR) are used which are defined as: Mean square error (MSE) is given as
m i n j j i DN j i N n m MSE 1 1 2 , , * 1 (7)Where m is number of rows in the image, N(i, j) is the noisy image and DN(i, j) is the de-noised image.
8. Peak Signal to Noise ratio (PSNR) is given as
9. FUTURE SCOPE
The field of image processing has been growing at a very fast pace. The day to day emerging technology requires more and more revolution and evolution in the image processing field. The work proposed in this paper also portrays a small contribution in this regard. This work can be further enhanced to de-noise the other type of images, like CT, Ultrasound, X ray images. It will provide a good add on to the already existing denoising techniques. Moreover, for future work we can train our algorithm using various techniques like fuzzy logic or neural network, in order to attain the best output without performing calculations for each and every combination.
10. Global Journal of Researches in Engineering

![variance, maxval is the highest pixel value in the image and the minval is the lowest pixel value in the image. Noise variance is estimated by the method Automatic estimation of the noise variance from the histogram of an MR image[16]. Output of thresholding is given by x = (abs(y) > thld).* y).](https://engineeringresearch.org/index.php/GJRE/article/download/608/version/100171/5-MRI-Denoising-Using-Waveatom-Shrinkage_html/3344/image-3.png)


| 25 | |||||
| Parameters | Denoised using Wave Atom with old threshold | Denoised using Wavelet with old threshold | Denoised using Wave Atom with new threshold | Denoised using Wavelet with new threshold | v v v IV Version I Volume XII Issue v D D D D ) |
| ( | |||||
| MSE(mean square error) PSNR( peak signal to noise ratio) S/MSE(signal to mean square error) SNR(signal to noise ratio) | 0.0034172 24.6632 dB 17.0783 dB 12.4240 dB | 0.0036304 24.4005 dB 16.8156 dB 12.0257 dB | 0.0022945 26.3931 dB 18.8082 dB 15.2194 dB | 0.002433 26.1386 dB 18.5537 dB 14.6561 dB | Global Journal of Researches in Engineering |
| Denoised using | Denoised using | Denoised using | Denoised using | |
| Parameters | WaveAtom with old | Wavelet with old | WaveAtom with | Wavelet with |
| threshold | threshold | new threshold | new threshold | |
| MSE(mean square error) | 3.5587e-005 | 3.8718e-005 | 3.3665e-005 | 3.5996e-005 |
| PSNR( peak signal to noise ratio) | 44.4871 dB | 44.1208 dB | 44.7282 dB | 44.4375 dB |
| S/MSE(signal to mean square error) | 36.9022 dB | 36.5359 dB | 37.1433 dB | 36.8526 dB |
| SNR(signal to noise ratio) | 30.6408 dB | 30.1310 dB | 30.7152 dB | 30.1635 dB |
| Denoised using | Denoised using | Denoised using | Denoised using | |
| Parameters | Wave Atom with | Wavelet with old | Wave Atom with | Wavelet with |
| old threshold | threshold | new threshold | new threshold | |
| MSE(mean square error) | 0.0027496 | 0.0028503 | 0.0019821 | 0.0021131 |
| PSNR( peak | ||||
| signal to noise | 25.6072 dB | 25.451 dB | 27.0287 dB | 26.7508 dB |
| ratio) | ||||
| S/MSE(signal to | ||||
| mean square | 14.3304 dB | 14.1742 dB | 15.7519 dB | 15.4739 dB |
| error) | ||||
| SNR(signal to noise ratio) | 10.2556 dB | 10.0420 dB | 12.2912 dB | 11.8558 dB |
| Denoised using | Denoised using | Denoised using | Denoised using | |
| Parameters | WaveAtom with | Wavelet with old | WaveAtom with | Wavelet with |
| old threshold | threshold | new threshold | new threshold | |
| MSE(mean square error) | 0.0071381 | 0.0073061 | 0.0055929 | 0.0058536 |
| PSNR( peak signal to noise ratio) | 21.4642 dB | 21.3631 dB | 22.5236 dB | 22.3258 dB |
| S/MSE(signal to mean square error) | 10.1873 dB | 10.0863 dB | 11.2468 dB | 11.0489 dB |
| SNR(signal to noise ratio) | 6.3210 dB | 6.1699 dB | 7.8936 dB | 7.5525 dB |