1. Introduction
rinding is a manufacturing process widely used in manufacture of parts and components requiring smooth surface and fine tolerance. Abrasive processes like grinding are the natural choice for machining very hard materials. In grinding operation a wheel containing the abrasive particles rotate at a specified velocity and a table below the wheel moves with reciprocal motion. As the abrasive particle come in contact with the workpiece surface they rub against the surface and removes a chunk of metal from it. This rigorous process on the metal surface produces ridges and valleys which can be quantified by the term surface roughness.
In high speed machining, conventional cutting fluid application fails to penetrate the chip-tool interface and thus cannot remove heat effectively [1], [2], [3].
Addition of extreme pressure additives in the cutting fluids does not ensure penetration of coolant at the chiptool interface to provide lubrication and cooling [4]. However, high-pressure jet of soluble oil, when applied at the chip-tool interface, could reduce cutting temperature and improve tool life to some extent [5], [6]. Grinding becomes an environmentally unfriendly manufacturing process when a large of amount of cutting fluid is used. Now-a-days efforts are being made to minimize the use of cutting fluid for its detrimental effect on human health and environment and for covering a large percentage of total manufacturing cost (around 17%). Cutting fluids are difficult and expensive to recycle. They can cause skin diseases like dermatitis and have fatal effect on respiratory and dietary system of the machine operator [7], [8], [9]. Inappropriately handled and poorly disposed cutting fluid may have great environmental impact [10]. As the result of these consequences significant pressure is needed to adopt toward stricter standard and rigid regulations. In today's manufacturing industry cost effectiveness depends largely upon the high production rate which entails the need of high speed machining. The use of MQL is of great significance in conjunction between large cutting fluids application and dry machining. Minimum quantity lubrication (MQL) also known as Near Dry Machining (NDM) or semi dry machining is an alternative to traditional use of cutting fluids. As the name implies, MQL uses a very small quantity of lubricant delivered precisely to the cutting surface. Often the quantity used is so small that no lubricant is recovered from the piece.
Minimum quantity lubricants (MQL) systems employ mainly cutting fluids that are nonsoluble in water, especially mineral oils. These oils, inhaled in the form of aerosol, reduce the health hazard factor [11]. It is found that the MQL technique provides efficient lubrication, reducing the grinding power and the specific energy to a level of performance comparable or superior to that obtained from conventional soluble oil, while at the same time it significantly reduces grinding wheel wear [12]. Another characteristic of this technology is that when properly applied, both parts and chips remain dry and are easier to handle [13]. Better cutting performance can be obtained with Minimum Quantity lubrication (MQL) than dry and flood cooling [3]. In MQL a mixture of pressurized air and oil micro-droplets are applied directly into the interface between the tool and the chip [14].
MQL grinding is still a relatively new research area, and only a few researchers have studied MQL grinding. Dhar et al. [15] investigated the effect of MQL technique to grind 16MnCr5 alloy steel on the cutting performance compared to completely dry cutting and flood cooling with respect to grinding temperature, surface roughness, chip morphology. The results indicated that the use of minimum quantity lubrication (MQL) by cutting oil (VG-68) leads to lower surface roughness compared to dry and wet environments. Silva et al. [16] investigated the performance of MQL system to grind ABNT 4340 steel (HRC 60) with alumina wheel. It was found that, MQL system leads to finer surface finish and higher compressive residual stress compared to dry and conventional cooling. The performance of MQL technique is investigated by Tawakoli et al. [17] for both hard steel 100cr6 and soft steel 42CrMo4. For LB8000 MQL oil with wheel speed 25 m/s and depth of cut 25µm the surface quality improvement in MQL grinding is found to be more significant in comparison to dry and fluid grinding. Barczak [18] studied the machining performance of MQL for mild steel (BS 970 080M40, 32±2 HRC), bearing steel (BS534A99, 62±2 HRC) and tool steel (BS BM2, 52±2 HRC) with alumina wheel. The performance was evaluated in terms of tangential force, surface roughness, force ratio and grinding arc temperature. It has been found that, Low grinding force makes the MQL a low temperature process. But the suitability of MQL is found limited to relatively softer material.
Experimental investigation to assess the surface quality of a ground surface for a specific wheel-work combination is time consuming. Predictive model in this case can give useful insight about the expected value of surface roughness. A probabilistic approach to predict surface roughness in ceramic grinding is depicted in [19] considering the random grit protrusion height and assuming individual grain as spherical.
2. II.
3. Experimental Conditions and Procedure
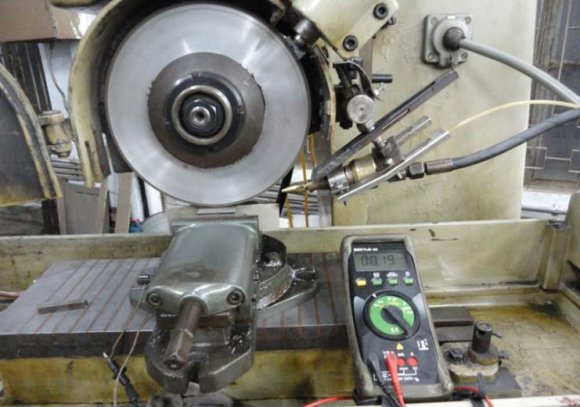
The purpose of the experimental investigation in this present research work is to measure the grinding surface roughness under Minimum Quantity Lubrication. The machining tests were carried out by grinding AISI 1045 steel with both alumina wheel and CBN wheel in a rigid surface grinder at different cutting condition under dry and Minimum Quantity Lubrication environment shown in Fig. 2. The ranges of cutting conditions chosen in the present investigation are representative of the current industrial practice for the tool-work material combination that has been investigated. The conditions under which the machining tests have been carried out are briefly given in Table 1. After grinding the steel specimen with alumina and CBN wheel the surface was checked rigorously. The surface features include general textures, plastic deformation of asperities, oxidations and cracks. All of them are usually the result of high grinding temperature. A typical parameter that has been used to quantify the quality of a surface is the surface roughness, which is represented by arithmetic mean value, R a. Here experimental investigation is performed on AISI 1045 steel under dry and MQL condition with different cutting condition. The roughness of the ground specimen is measured in transverse direction by a Taylor Hobson Talysurf Surtonic 3+ roughness checker, UK. The sample length is taken as 0.8 cm. Fig. 3 shows the experimental surface roughness of the ground surface for Alumina wheel with different process parameters for both dry and MQL cooling environment. High roughness value is observed for dry cutting at higher infeed value. Fig. 4 shows the roughness values for machining AISI 1045 steel with CBN wheel. From figure it has been found that Surface roughness value is substantially lower for MQL than dry in all conditions. It is also observed that in most of the cases for both dry and MQL condition CBN produced better surface finish than alumina wheel. ( )
o 1 2 3 n , , , ... . f ? ? ? ? ? ? ? = + (1)Here f is the true response function which is unknown and perhaps very complicated and ? is a term that represents other sources of variability not accounted for in f. usually ? includes effects such as measurement error on the response, background noise, the effect of other variables, and so on. Usually ? is treated as a statistical error, often assuming it to have a normal distribution with mean zero and variance.
( ) ( )
o 1 2 3 n o 1 2 3 n ( ) , , , ... . ( ) ,x ,x ,x ...x . E y f E f x ? ? ? ? ? ? ? = = + =(2)In much RSM work it is convenient to transform the natural variables to coded variables o 1 2 3 n , , , ... x x x x x , which are usually defined to be dimensionless with mean zero and the same standard deviation. In terms of the coded variables, the response function, which is the expected value of ? can be written as, For the case of two independent variables, the second-order model in terms of the coded variables is,
2 2 1 1 2 2 11 1 22 2 12 1 2 o y x x x x x x ? ? ? ? ? ? = + + + + +(3)In general the second order response surface model takes the following form,
2 1 1 2 k k k o j j jj j ij i j j j i j y x x x x ? ? ? ? = = < = = + + + ? ? ??(4)Where, f is the response function and a o , v s , v w are the infeed, wheel speed and workspeed and '?' is the error which is normally distributed with mean zero.
The second order response function for surface roughness R a as a function of the infeed, wheel speed and workspeed can be written as in Eq. ( 5).
a v v a v v a v a v v v a o s w o s w o s o w s w R ? ? ? ? ? ? ? ? ? ? = + + + + + + + + +(5)Where R a is the response, ? 0 , ? 1 , ? 2, ? 3, ? 11 , ? 22 , ? 33, ? 12 , ? 13 and ? 23 are the constants.
Here a custom Response Surface Design is created using Minitab 16.1.1 statistical software package and experimental results are used to predict the relationship between three input variables (infeed, wheel speed, work speed) and the response (surface roughness). To assess the influence of the factors to response and interaction between them, the main effect plot and interaction plot is created. The points in the plot are the mean of the response variable at the various levels of each factor, with a reference line drawn at the grand mean of the response data.
Fig. 5(a) show the variation of individual responses with the three parameters i.e. infeed, wheel speed and work speed separately. The plot indicates that, for increasing infeed there is a continuous increase in surface roughness. Roughness decreases with increase of wheel speed but increase a little with increasing work speed. The second order model was postulated in obtaining the relationship between the main cutting force and the machining independent variables. The developed second order mathematical model is given in Eq. ( 6). The total analysis was done using uncoded units. The term R 2 is the percentage of response variable variation that is explained by its relationship with one or more predictor variables. The greater the value of R 2 the better the model fits the given data. Here the co-efficient of determination R-Sq = 96.46 % indicate that the equation is able to predict the roughness values with 96.46 % accuracy.
The detailed statistical analysis of the variables that are used in the equation has been given in Table 2. Here, the P-values are used to determine which of the effects in the model are statistically significant. The ? value is assumed as 0.05. From Table 3, it can be clearly stated that, linear and the interaction effects of the cutting process variables are statistically significant since their P-values are less than 0.05.
Analysis of variance (ANOVA) is similar to regression in that it is used to investigate and model the relationship between a response variable and one or more predictor variables. The residual is the difference between an observed value (y) and its corresponding fitted value (?). The residual plots are used to check the goodness of the model fit. The residual plots are used to check the goodness of the model fit. The points in this plot should generally form a straight line if the residuals are normally distributed. Here in the normal probability plot the data points are fairly close to the fitted line. Small deviation at two ends may be due to the small number of observations. Residuals versus fits plot shows the comparison of fitted value against the residuals. This plot should show a random pattern of residuals on both sides of zero. Here the points are random and evenly distributed on both side of zero line moreover, no pattern is detected. . In Fig. 6 (c of skewness at the right end. This may be due to small number of observations. Residuals versus order plot shows all residuals in the order that the data was collected and can be used to find non-random error, especially of time-related effects. No such effect was detected in the current experiment. In order to validate the developed model, the experimental surface roughness at different infeed, wheel speed and workspeed has been compared with the predicted value. The pressure and flow rate of the MQL are maintained at 80 bar and 2.0 l/min respectively. In Table 4 the combination of infeed, wheel speed and workspeed for different test have been shown.
4. IV. Results and Discussion
In this research AISI 1045 steel is ground with alumina and CBN wheel under dry and MQL cooling environment. The surface generated by grinding consists mostly of overlapping scratches produced by the interaction of abrasive grit with the workpiece. Figure 3 and 4 shows the surface roughness of the ground component for two different wheel speed, two different work speed and five different values of infeed consecutively for two different types of wheel. In all cases MQL produces lower values of roughness than dry environment. The lubrication is more effective at lower wheel rotational speed. The lower roughness value is due to more effective lubrication and cooling of the abrasive grains at the workpiece-tool interface. Efficient lubrication allows the chips to slide more easily over the tool surface and results in a better surface finish. Study of the ground surfaces also indicates that in MQL grinding the metal removal takes place mostly by shearing and fracturing, unlike prevalence of plastic deformation, grain pull-out and ploughing in conventional fluid and dry grinding.
Higher rpm of wheel produces lower surface roughness. In higher rpm more abrasive grit come into contact with the work surface thus overlapping cutting remove the surface flaws and smoother surface is obtained. From Fig. 3 it is evident that for higher rpm and higher work speed, MQL environment can produce better surface finish. There are some irregularities in the dry roughness value for 0.08m/s work speed and 30µm infeed. This may be the result of wheel loading and chip clogging. Roughness value increases with increasing infeed as for higher depth of cut, grains penetrate deep in the workpiece and remove bigger chunk of material in each contact. As a result higher peak and valley distance is created which in turn affects the surface roughness. Fig. 4 shows the roughness value with CBN wheel. Here surface roughness for both dry and MQL steadily increased with increasing infeed value.CBN grains are harder than conventional abrasive wheel so they retain their sharpness and can cut through the workpiece smoothly producing lower surface roughness.
The surface burn is observed during grinding under dry condition. The surface becomes burnt blue when machining at 50µm infeed in dry environment. Minimum Quantity Lubrication results burn free surface due to retained grit sharpness and less rubbing and ploughing though at very high infeed the surface become blackish indicating slight sign of surface burn.
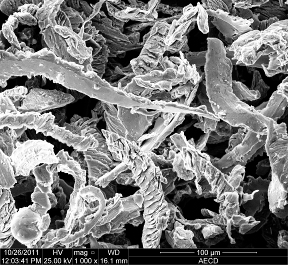
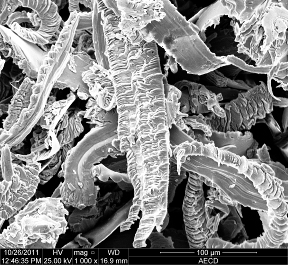
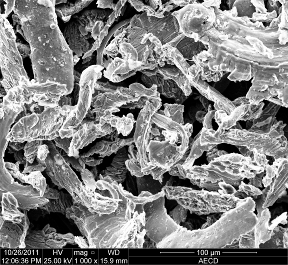
The morphology of grinding chips produced by different infeed and cooling environment can be explained with the mechanism of chip formation and material removal. The chips produced during grinding AISI 1045 steel at lower infeed (10 µm and 20µm) have been shown in Fig. 5 under different cooling environment. Both 10µm and 20µm infeed produced different types of chips such as lamellar, flaky and irregular shaped particles with overlapping scratches produced by the interaction of abrasive particles with the workpiece. The flaky shape is produced mainly by rubbing action between abrasive grit and workpiece. At higher infeed (30 ?m) some spherical chips are found indicating excessive heating. In all cases MQL produced longer lamellar chips with nearly equal width. The surface of the chips is also less rough in MQL than dry grinding environment. The reason is, in MQL effective lubrication allows the chip to slide more easily over the work surface providing better surface finish. In dry grinding the chip formation particularly involves shearing, ploughing and rubbing. However, the chip formation in MQL is mainly shearing due to low grinding zone temperature.
Due to change in infeed no substantial variation in type and length of the chips could be found. In most of the cases wider chips are obtained at higher infeed which indicates higher penetration of abrasive particles into the workpiece.
In real life, application of grinding operation is not limited to these experimental values. Varity of grinding conditions may be used in different industries. So it is necessary to know the roughness value for other experimental conditions and this is where empirical modeling has come into action. The developed model in Eqn. 6 can predict the roughness value with 93.49% accuracy. The statistical conformity of the model is verified by Analysis of Variance (ANOVA) analysis in table 3 and by Residual plots in Figure 6. The model passed the conformity tests with slight variation which may be due to the small number of observations. In Fig. 7 predicted values from RSM models have been plotted and compared with the experimental values. From these figures it can be concluded that the RSM can predict the trend of the experimental data and predict the surface roughness with a reasonable amount of error.
V.
5. Conclusions
Based on the research work which is mainly analytical aided with experimental investigation, the following issues can be concluded, i. Surface roughness of the ground surface is evaluated for AISI 1045 steel under dry and MQL condition with CBN and Alumina wheel. The MQL provided lower value of surface roughness with reduced burn of the surface than dry grinding. The roughness is found to be proportional to infeed and wheel rotational speed. The work speed is also found to have a strong correlation with the roughness value.
ii. In all cases CBN wheel produces lower value of surface roughness than Alumina wheel. The increase of roughness value with the increase of infeed is more stable for CBN wheel than Alumina wheel. High thermal conductivity of CBN wheel Volume XII Issue V Version I enhances heat conduction away from the grinding zone to the wheel.
iii. In MQL grinding chips are long, lamellar chips compared to the dry grinding where small and more irregular shaped chips are found. Chip formation mode shifted from ploughing, rubbing and shearing to sharp shearing due to retention of sharpness of abrasive grit and lesser ductility of steel under low temperature.
iv. A second order response surface model is developed to predict the surface roughness of AISI 1045 steel with CBN wheel under MQL condition. The model can predict the roughness with 96.46 % accuracy.
vI. Acknowledgement

| Machine tool | : Surface Grinder, China(2.1/2.8 KW) | |
| Work materials | : AISI 1045 steel | |
| Grinding Wheel | : | CBN Wheel(Grain Size-107 µm, Grain Concentration-4.4 cts/cm 3 , CBN layer thickness-4 mm) |
| Grinding Mode | : Down cut | |
| Process parameters | ||
| Spindle Speed | : 1500 rpm, 3000 rpm | |
| Wheel speed, v s | : 15.21 m/s, 31.42 m/s | |
| Infeed, a o | : 10, 15, 20, 25, 30, 40, 50 µm | |
| Table Speed, v w | : 0.08 m/sec, 0.1 m/sec | |
| Minimum Quantity Lubrication (MQL) | : 30 bar, Coolant: 2.0 ml/min through external nozzle | |
| Coolant type | : VG-68 (ISO grade) | |
| Environment | : | Dry and Minimum Quantity Lubrication (MQL) |
| 2.0 | ||||||||||||
| 2.4 | Dry-Wheel speed :15.71 m/s | Dry-Wheel speed :15.71 m/s | ||||||||||
| 2.2 | Dry-Wheel speed :31.42 m/s MQL-Wheel speed :15.71 m/s | 1.8 | Dry-Wheel speed :31.42 m/s MQL-Wheel speed :15.71 m/s | |||||||||
| 2.0 | MQL-Wheel speed :31.42 m/s | 1.6 | MQL-Wheel speed :31.42 m/s | |||||||||
| Surface Roughness(µm) | 0.6 0.8 1.0 1.2 1.4 1.6 1.8 | Work material : AISI 1045 Work speed : 0.1 m/s | Surface Roughness(µm) | 0.6 0.8 1.0 1.2 1.4 | Work material : AISI 1045 Work speed : 0.08 m/s | |||||||
| 0.4 | ||||||||||||
| 0.4 | ||||||||||||
| 0.2 | 0.2 | |||||||||||
| 0.0 | 0.0 | |||||||||||
| 10 | 20 | 30 | 40 | 50 | 10 | 20 | 30 | 40 | 50 | |||
| Infeed(µm) | Infeed(µm) | |||||||||||
| Term | Co-efficient | SE Co-efficient | T | P | |
| Constant | -0.38450 | 0.31951 | -1.203 | 0.252 | |
| o a | -0.00459 | 0.00691 | -0.664 | 0.519 | |
| s v | 0.04408 | 0.01071 | 4.115 | 0.001 | |
| w v | 9.27500 | 3.44537 | 2.692 | 0.020 | |
| o a | 2 | -0.00001 | 0.00005 | -0.165 | 0.872 |
| o a v s × | -0.00019 | 0.00008 | -2.305 | 0.040 | |
| o a v w × | 0.19750 | 0.06398 | 3.087 | 0.009 | |
| w v v s × | -0.56652 | 0.11519 | -4.918 | 0.000 | |
| Source | DF | Seq SS | Adj SS | Adj MS | F | P |
| Regression | 7 | 0.535447 | 0.535447 | 0.076492 | 46.72 | 0.000 |
| Linear | 3 | 0.471492 | 0.471492 | 0.157164 | 95.99 | 0.000 |
| Square | 1 | 0.000045 | 0.000045 | 0.000045 | 0.03 | 0.872 |
| Interaction | 3 | 0.063910 | 0.063910 | 0.021303 | 13.31 | 0.000 |
| Residual error | 12 | 0.019648 | 0.019648 | 0.001637 | ||
| Total | 19 | 0.555095 |
| Test No. | T1 | T2 | T3 | T4 | T5 | T6 | T7 | T8 | T9 | T10 | ||||||
| Infeed, a o (µm) | 10 | 20 | 30 | 40 | 50 | 10 | 20 | 30 | 40 | 50 | ||||||
| Wheelspeed, v s (m/s) | 15.71 15.71 | 15.71 | 15.71 | 15.71 | 31.42 | 31.42 | 31.42 | 31.42 31.42 | ||||||||
| Work speed, v w (m/s) | 0.1 | 0.1 | 0.1 | 0.1 | 0.1 | 0.1 | 0.1 | 0.1 | 0.1 | 0.1 | ||||||
| Test No. | T11 | T12 | T13 | T14 | T15 | T16 | T17 | T18 | T19 | T20 | ||||||
| Infeed, a o (µm) | 10 | 20 | 30 | 40 | 50 | 10 | 20 | 30 | 40 | 50 | ||||||
| Wheelspeed, v s (m/s) | 15.71 15.71 | 15.71 | 15.71 | 15.71 | 31.42 | 31.42 | 31.42 | 31.42 31.42 | ||||||||
| Work speed, v w (m/s) | 0.8 | 0.8 | 0.8 | 0.8 | 0.8 | 0.8 | 0.8 | 0.8 | 0.8 | 0.8 | ||||||
| The comparison of experimental and predicted value of surface roughness for 20 test samples are | ||||||||||||||||
| illustrated in Fig 7. | ||||||||||||||||
| 1.4 | ||||||||||||||||
| Surface Roughness, R a , µm | 0.2 0.4 0.6 0.8 1.0 | Experimental value Predicted value | Surface Roughness, R a , µm | 0.2 0.4 0.6 0.8 1.0 1.2 | Experimental value Predicted value | |||||||||||
| 0.0 | 0 | 2 | 4 | 6 | 8 Test number 10 12 14 16 18 20 (a) | 0.0 | 0 2 4 6 8 10 12 14 16 18 20 Test number | |||||||||