1. Introduction
everse osmosis is a pressure-controlled process that is used to clean and desalinate water. It's a membrane separation mechanism that recovers water to a point greater than the osmotic pressure of the solution from a pressurized saline solution. The process of reverse osmosis is used effectively to remove salt and to reduce organic and inorganic components [1]. This process is used primarily for drinking water treatment, wastewater reuse, water desalination, industrial wastewater treatment, oil field water treatment, marine desalination, and various water treatment plants.
The total cost of water is estimated by the addition of capital costs to the operating costs [2]. As materials improved and costs decreased, the use of membrane desalination increased. Today, reverse osmosis membranes are the leading technology for new desalination installations, using tailored pre-treatment and membrane system design to apply them to a variety of salt water resources [3]. The use of membrane processes for treating and reusing wastewater is expanding rapidly. Reverse osmosis (RO) membrane processes effectively remove organic, inorganic, and biological constituents [4]. RO systems extract contaminants from water like nitrates, chemicals, chlorides, toxins, pharmaceuticals, arsenic and much more. A RO carbon filter system will also eliminate chlorine and hardness [5]. These treatment systems have some moving or replaceable components, which is why cleaning and servicing is very simple.
Filtration of reverse osmosis provides water which is better than bottled. It is also cost-effective when compared with water quality. Due to its relatively low energy consumption, reverse osmosis is an increasingly common desalination method [6].This technology has been shown to be useful in treating a wide range of effluents from the chemical, textile, pulp and paper, petroleum and petrochemical industries, food, tanning and metal finishing industries, although it has very strict requirements for the concentration of suspended solids, fibers and oily components [7]. In the pharmaceutical, fiber, petrochemical, electrochemical, food paper and tanning sectors, RO membranes can be used to produce high quality water and to recycle wastewater effluents [8].
In a typical coastal reverse osmosis plant, in the proposed approach, 3 to 10 kWh of electrical energy is required to produce one cubic meter of freshwater, since only the product water needs to be pumped to the surface, the specific energy consumption can be reduced to 2.46 kWh [9]. A huge amount of energy is needed to let the water through the RO membranes in seawater desalination. Brackish water RO desalination typically involves fewer energy around the same recovery than seawater desalination because of low salinity [10]. Setting up an energy recovery system can lower energy consumption from 6-8 kWh / m3 to 4-5 kWh / m 3 , which might be further reduced to 2 kWh / m 3 . RO systems powered by gas / steam turbines have generally lower costs (0.43$/m 3 ), and brine staging units can boost water recovery and lessen specific power consumption [11]. The amount of freshwater that can be extracted is therefore reduced to as little as 25% to 45% for seawater but as high as 90% for brackish water. A R Assessment of Water Quality and Power Consumption in Small Size Reverse Osmosis Water Treatment Units 25% increase in energy prices will drive up the cost of produced water by 11% at these levels [12]. Reverse osmosis is an effective technology for removing arsenic that has been proven through bench and pilot scale studies according to a report prepared for the US-EPA. Arsenic is very effectively removed by RO in the generally high oxidation states of (V). Practical processes can be developed with RO to remove all major arsenic species from water with further attention to removing the weakly acidic arsenic species in waters by operating RO at sufficiently high pH made possible by the newer antiscalants [13]. More than 15,000 desalination plants are in operation around the world today, and about 50 percent of these are RO plants. The Middle East holds about 50% of the world's production capacity (and 2.9% of the world's population), and has forged ahead as the leader in large-scale desalination of seawater. In 2005, Israel opened the largest RO desalination plant in the world with a capacity of 330,000m 3 /day or 100 million m 3 /year [14]. In 2005, the United Arab Emirates (UAE) opened its desalination plant in Fujairah, combining MSF and RO technology to produce 454,000m 3 /day of freshwater [15].
Countries in North Africa and the Middle East, such as Algeria, Tunisia, and Jordan, have minimal freshwater supplies and studied utilizing desalination of both brackish and coastal waters. The world's largest RO desalination plant for brackish water was completed in 2006 in Wadi Ma'in, Jordan, operating at 129,000m 3 /day, with a maximum capacity of over 150,000m 3 /day [16]. Algeria plans to increase the number of plants from 10 to 43 by 2019, with an output goal of 2 million m3/day; in 2007, production started at Algeria's capital city, Algers, with the largest RO desalination plant in Africa (200,000 m 3 /day). Countries in South America, such as Chile, have recently set up massive desalination plants and Australia is dealing with a water crisis with modern RO projects from Sydney to the Gold Coast [17]. The desalination plant site should be carefully selected and especially for forward planning for possible future expansions should be away from residential areas. The main cause of emissions is the noise pollution, visual pollution, depletion in outdoor fishing and bathing sites, leakage of pollutants into the water, the brine drainage and forms of disposal methods used. The RO membranes, however, are susceptible to fouling and scaling and as such need to be regularly cleaned with chemicals that may be toxic to receiving waters [18].
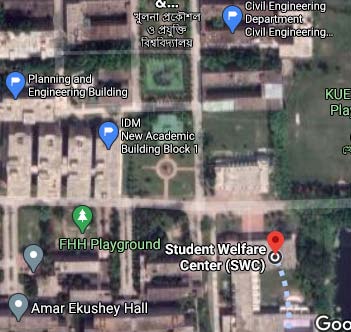
Khulna is the commercial and port city of Bangladesh, situated in South West Bangladesh. At present, the Khulna water supply network relies entirely on the source of groundwater. In the Khulna area, drinking water availability is not viable due to high salinity and iron. Clean water supplies are minimal at the KUET campus and the amount of available water is not adequate as needed. The quantity of safe drinking water needs to grow as the total population of KUET rises each year. Salinity is the major issue here. The main problem at KUET campus is salinity. The gross dissolved solid is, however, very small. Using the water treatment method Reverse Osmosis will easily remove these issues. The selected RO filters for this study are installed in Planning and Engineering Building, IDM, Civil Engineering Department and Amar Ekushey Hall. This research aims to differentiate the parameters of water quality from four chosen outlets and to establish the physical and chemical characteristics of the treated water. Water was obtained on a weekly basis and pH, color, conductivity, turbidity, chlorides, total coliform, fecal coliform, dissolved oxygen, total solids, total dissolved solids, hardness, total chlorine. Monthly data on power consumption and water production is gathered to determine the power consumption whether it is cost-effective or not. In addition, this study aims to monitor RO filter maintenance and a questionnaire was carried out at Amar Ekushey Hall among students about the water quality and service of RO water system at their residential hall. Several investigations were carried out.
2. II.
3. Research Methods
For this research Khulna University of Engineering & Technology (KUET) was chosen as the study area. It is located at Teligati and has a total area of 101 hectares. It is located about 15 km north of Khulna's main city. Khulna, the Teligati area in particular, is suffering from acute water scarcity due to unplanned urbanization and increased salinity in both surface and groundwater. To solve the problem, an effective water treatment system is needed.
Reverse osmosis filter is used in almost all buildings in KUET. Since the other water sources are scarce, the plant with Reverse Osmosis plays a very important role. The filtered water is used only for purposes in drinking water. Since this is a complete setup, there is no need for a distribution network to deliver potable water handled by RO water treatment plant. Four KUET campus reverse osmosis units have been chosen for monitoring one is situated in New Academic Building outside the lDM (Institute of Disaster Management), one is installed in the Department of Civil Engineering, one is installed in the Amar Ekushey Hall and another one is the Planning and Engineering Building. The bottle was washed several times with distilled water before collecting water samples. The bottles were then air dried or sun dried. After that the bottles were prepared for collecting water sample. Water samples were obtained each week for testing the water quality of the raw and treated water. Twenty water samples were collected for each location for this study spanning a year. They were obtained from the feed water from the selected four locations. The performance of RO filter had to be contrasted with both treated and feed water.
4. d) Water Quality Index
To recognize and analyse the water quality of all the water samples, the WQI was used. WQI is characterized as a relative influence and significance of various water quality parameters on the quality of water. First, each of the parameters was given a weighting level (w i ) according to its relative contribution and importance according to the predicated weightage given to each water quality parameter by World Health Organization (WHO). For each sample, a comparison study was conducted against the value calculated from lab testing results with the desired limit specified by WHO for each parameter, and weightage was assigned to each parameter based on self-analysis of results and comparison to WHO's predicted weightage.
Second, using the equation below, the relative weightage ( ?? ?? ) of each water quality parameter was calculated:
Wi = ? ???? ?? ??=1 ?? ?? = (?? ?? /?? ?? ) * 100Where n denotes the number of parameters considered in the WQI calculation, and ?? ?? denotes the weightage calculated or assigned to each parameter [5][6]. In the third step, a quality rating value ( ?? ?? ) for each water quality parameter was calculated by dividing the parameter's known concentration in each water sample after analysis by the standard permissible concentration specified in WHO, and multiplying by 100.
?? ?? is the concentration of each water quality parameter in each water sample, and ?? ?? is the concentration stated according to WHO [21].The subindex ( ???? ?? ) for each water quality parameter is then calculated using the equation below to calculate WQI:
???? ?? = ?? ?? * ?? ?? WQI = ? ???? ?? ?? ??=1 c) Water5. Results and Analysis a) General Water Quality Characteristics
From the eighty samples collected from the selected four locations tested were carried out for both raw water and treated water. The statistical values such as the maximum, minimum, average, standard deviation and variance were calculated to get an understanding of the water quality of the raw water. From table 1 we can see that conductivity, chlorides (salinity), total solids, total dissolved solids and hardness of raw water surpassed the permissible limit for drinking water according to WHO standards. Standard deviation value stipulates how much the parameter is deviated from the average value. Total dissolved solids have the highest standard deviation meaning that TDS values are spread out from the average. Total chlorine has the least standard deviation indicating it is closely near to the average value. The term variance refers to a statistical measurement of the spread between numbers in a data set. A large variance indicates that numbers in the set are far from the mean and far from each other. A small variance, on the other hand, indicates the opposite.
Here we can see that conductivity has the highest variance of 72071.41 and total chlorine has the lowest variance of 0.000169. For this study the along with the raw supplied water of the area the treated reverse osmosis water was also tested to see the removal efficiency and the compare the water quality values before and after going through the reverse osmosis treatment. From table 2 we can see that conductivity has the highest standard deviation of and Total coliform (TC) and Fecal Coliform (FC) has the lowest standard deviation. Also, Total Solids (TS) has the highest variance and TC and FC has the lowest variance among the treated water quality parameters. Another significant thing we can see that is after going through the reverse osmosis treatment the water quality parameters such as conductivity, chlorides (salinity), TS, TDS and hardness values is well within the acceptable limit of drinking water according to WHO standard, which wasn't the case for the raw water. The removal efficiency is above 90 percent for conductivity, chloride, TS, TDS, color, TC, FC and total chlorine which enables the values to be good enough for drinking. After the reverse osmosis treatment, the hardness value becomes well within the WHO drinking standard, but its removal efficiency is much lower at 57.71 percent than the other water quality parameters. But the value of turbidity is well within the permissible limit for drinking but its removal efficiency is very low at 22.50 percent. 3 all the values of the permissible limit were inducted according to the WHO guideline but dissolved oxygen has no fixed guideline according to WHO. So, to calculate the water quality index the value considered for dissolved oxygen was 6.5 because the range of values of dissolved oxygen good for warm water was 6.5-9.5. Again, there is no removal efficiency for the value of pH and dissolved oxygen, the reason being these two water quality parameters have no such contribution to the overall water quality of drinking standards. They have a certain range of values that are considered adequate in drinking water but no permissible limit that can't be exceeded. That's the reason the removal efficiency is not calculated or considered for the values of pH and dissolved oxygen.
6. b) Water Quality Index Calculation
Selected water quality parameters were tested at four different locations in KUET. The selected filters are RO unit 1 (Planning and Engineering building), RO unit 2 (IDM), RO unit 3 (Civil Engineering department), RO unit 4 (Amar Ekushey Hall). The samples were tested for raw water and treated water to understand the water quality index and category of water. Water quality index (WQI) is an important indicator of the overall water quality of drinking water. It can be seen from table 4 that for raw water the range of water quality index is 124-132 summarizing the category of drinking water to be poor. From table 5 it is seen that for the reverse osmosis treated water the water quality index is in the range of 28-30, it indicates that the treated water is excellent in category. So, the value of the water quality index falls drastically after going through the reverse osmosis water treatment units. The supplied raw water from all four locations had poorquality water but after the reverse osmosis water treatment the purified water from all the locations became inducted in the excellent water category.
7. Date
Meter From figure it is observed that, power consumption and water production increase with time as water demand.
8. d) Cost of RO Water Treatment
From the power consumption, cost of water production per month is determined. The cost (taka BDT) is calculated according to BERC (Bangladesh Energy regulatory Commission). According to BERC- As the power consumption per month is less than 50 units (1kWh= 1 Unit), per unit cost 3.5 Tk is taken. Per month power consumption, water consumption and cost are shown in the table 8 (1$= 85Tk.).
The cost of electricity and the water production values will give a better understanding of the overall cost and effectiveness according to its cost.
9. Water production (liter)
Water production (liter) Power consumption(kWh)
10. C
From figure 3, it is observed that the maximum water production per month of RO is 1021 liter in the planning and engineering building RO filter. The monthly cost does not exceed 40 tk. Hence, using an RO filter is economic as compared to its effectiveness. Per cubic meter cost of water production by RO 27 tk.
11. e) Maintenance of RO Water Treatment Plant
It's been nearly two years since the Reverse Osmosis (RO) units were installed at Engineering Building, IDM, Civil Engineering department and Amar Ekushey hall. At this time, no obstructions or problems have occurred. Different works and methods were observed that have preserved the function of the RO water treatment system. A person is always involved in the maintenance and monitoring of RO units. The sediment filter and carbon filter need to be changed C after 6-12 months. Though it depends on the quality of source water. Sediment Filter is designed to remove sediment and dirt from the water so your carbon filter and RO membrane doesn't get clogged prematurely.
Every water system might have different amounts of sediment in the input water so there is no fixed amount of time that is the same for every system. Water from Sediment Filter is passed through the carbon filter (also known as the Activated Carbon Filter), which removes chlorine and other organic contaminants. Carbon filters also filter out the bad odour and unpleasant taste from the water. As the water of KUET campus area enriched with high salinity, a large amount of total dissolved solid and hardness sediment filter and carbon filter was changed within 3 months. If you take good care of the sediment and carbon filters, and replace them at the required intervals then RO membrane only needs to be changed after purification of 6000-7000 litres of water. The RO membrane may die early or last longer depending on the TDS of input water. The replacement of RO membrane will be based on the consumption of water, quality of input water and efficiency of sediment filter and carbon filter. Typically, RO Membranes last for about 2-3 years. Your RO membrane may die earlier if you have really hard water or if you never flush the membrane. In the RO system of planning and Engineering building that we observed it produced nearly 7800 litres of water from April 2019 to February 2020. So, because of the high salinity and hardness of raw water along with producing huge amounts of water the RO membrane was changed within a year to maintain the quality and production of the RO water treatment system.
12. f) Flavour Profile Assessment
A short questionnaire survey was done among the people who use reverse osmosis treated water in the four selected RO filters. Among the 250 people who participated in the survey most were from Amar Ekushey Hall because it is the most frequent use of any other filter and has the greatest number of users who use it daily for drinking purposes. Different questions were asked to them from their knowledge of the RO filters to their overall satisfaction about the quality of the treated water. We all know apart from being tested in a lab the most usual way for the general people to judge a sample of water is through the initial color, taste and smell of the water. So, their opinion was that their preference of the attributes that most enables them to make their decision about their treated drinking water and their assessment of the color, taste and smell of the RO filter water. From table 9 we can see that people's opinion about the treated drinking water was given an option of being very satisfied to very satisfied and a rating was given to them according to the opinion from very satisfied was assigned rating of 5 to very dissatisfied was assigned to a rating of 1.
From figure 5 we can clearly assume that most of the consumers of treated water have a preference towards taste of the water most that means before judging a water sample their taste of water has a more profound impact on the overall quality assessment of the drinking water and according to the surveyed people color has the least impact on their assessment of a good quality drinking water. From figure 6 we can see that very few people about 7.2% of people are very dissatisfied and given a rating of 1 with the taste of RO treated water and 35.2% of people are very satisfied and have given a rating of 5 for the taste of the drinking water. As for the smell 52.8% of people have given a rating of 5 and about 1.2% of the people are neutral giving a rating of 3 as they think the smell is not too bad or too good for their liking. For color 33.6% of people are satisfied and given a rating of 4 and 24.8% of people are dissatisfied with the color of treated water giving a rating of 2.
13. IV.
14. Conclusions
For understanding the water quality of the raw water and treated water different parameters were tested and the electricity usage and water consumption per month were also monitored and calculated.
Maintenance of the RO water treatment system was also observed for the continuing to maintain quality of treated water and functioning fully. pH value is acceptable ranges in both cases (treated and raw water) according to WHO. Salinity of raw water exceeds the acceptable limit. It can be easily used for residual purposes but without treatment it is not suitable for drinking. RO filtering removes a significant amount of chlorides. It can be seen that the chloride value is high for the raw water but it reduces significantly after treatment. From table 2 it can be seen that the removal efficiency of RO water treatment system is very high, more than 90 percent for most of the parameters that have been tested. Only turbidity is not reduced by that much, accounting for only about 22% and hardness is moderately reduced to nearly 58 percent. DO is quite good. The amount of total dissolved solid is very high (940-1450 mg/L) and C sometimes is in unacceptable range (>1200 mg/L). TDS value of treated water is almost below the allowable range (50-150 mg/L) which is not harmful though. Total chlorine is pretty much non present in treated water. The raw supplied water had a water quality index of about in range of 120-135 in all four selected RO Units which attributes to being categorized as poor water. But after being purified the treated water had a water quality index about in range between 25-30 which makes the treated water on the RO units as excellent water. Almost a one-year study shows that the water production of RO filters is gradually increasing which indicates the demand is increasing. In April to July water production varies from 367-721 liter and in October to December it is 552-1021 liter. Though installation cost of RO filter is high, apparently 10,500-19,000tk BDT, per month water production cost is very low. The monthly cost does not exceed 40 Tk. Per cubic meter cost of water production by RO is 27Tk. The maintenance of this filter isn't so complicated. It doesn't need any training or study to operate this. Also, changing the sediment filter or carbon filter is easy. Sediment filter and carbon filter required to be changed within 2.5 -4 months. From the survey about the quality features of the RO treated water it was found that the consumers find the taste of the water most important ahead of smell and color. Along with that the people consuming RO treated water are overall quite content with the quality of the drinking water.
![Third and the last step were to compute WQI values are classified into five categories:Excellent water (WQI ? 50); Good water (WQI = 50-100); Poor water (WQI = 100-200); Very poor water (WQI = 200-300); Water unsuitable for drinking (WQI ? 300)[22].](https://engineeringresearch.org/index.php/GJRE/article/download/2138/version/101503/5-Assessment-of-Water-Quality_html/32385/image-3.png)
| Parameter | wi | Wi = wi/?wi | WHO Standard |
| pH | 4 | .08 | 6.5-8.5 |
| EC | 4 | .08 | 400 |
| Turbidity | 3 | .06 | 5 |
| Chloride | 5 | .10 | 250 |
| TS | 4 | .08 | 1200 |
| TDS | 4 | .08 | 600-900 |
| Hardness | 5 | .10 | 180 |
| Color | 3 | .06 | 15 |
| DO | 3 | .06 | 6.5 |
| TC | 4 | .08 | 0 |
| FC | 4 | .08 | 0 |
| Total Chlorine | 4 | .08 | 4 |
| ? ???? = 47 | |||
| e) Power and Water Consumption | |||
| III. |
| Parameter | Maximum | Minimum | Average | Std. Deviation | Variance | WHO Standard |
| pH | 8.20 | 6.42 | 7.15 | 0.279899 | 0.529055 | 6.5-8.5 |
| EC(µs/cm) | 2030 | 1143 | 1508.25 | 268.4613 | 72071.41 | 400 |
| Turbidity (NTU) | 3.57 | 1.67 | 2.29 | 0.339099 | 0.114988 | 5 |
| Cl -(mg/L) | 750 | 385 | 559.36 | 99.09198 | 9819.221 | 250 |
| TS (mg/L) | 1780 | 1080 | 1461.46 | 130.4244 | 17010.52 | 1200 |
| TDS (mg/L) | 1700 | 920 | 1380.38 | 176.3526 | 31100.26 | 600-900 |
| Hardness (mg/L) | 245.56 | 166.28 | 202.96 | 13.04427 | 170.1530 | 180 |
| Color (Pt.Co) | 52 | 0 | 9.75 | 18.73387 | 350.9578 | 15 |
| DO (mg/L) | 8.2 | 6.2 | 7.30 | 0.664989 | 0.442210 | 6.5 |
| Parameter | Maximum | Minimum | Average | Std. Deviation | Variance | Removal Efficiency (%) | WHO Standard |
| pH | 8.15 | 6.10 | 6.28 | 0.379682 | 0.144158 | 6.5-8.5 | |
| EC (µs/cm) | 331 | 80 | 148.25 | 59.10229 | 3493.081 | 91.30 | 400 |
| Turbidity (NTU) | 2.25 | 1.36 | 1.90 | 0.284327 | 0.080842 | 22.50 | 5 |
| Cl -(mg/L) | 105 | 33 | 56.21 | 18.16184 | 329.8526 | 90.13 | 250 |
| TS (mg/L) | 320 | 80 | 129.85 | 58.00626 | 3364.726 | 90.15 | 1200 |
| TDS (mg/L) | 280 | 50 | 95.36 | 49.82271 | 2482.302 | 93.08 | 600-900 |
| Hardness (mg/L) | 106.68 | 65.15 | 85.32 | 10.04610 | 100.9243 | 57.71 | 180 |
| Color (Pt.Co) | 36 | 0 | 6.25 | 14.43123 | 208.2605 | 96.54 | 15 |
| DO (mg/L) | 8.1 | 6.4 | 7.42 | 0.493003 | 0.243052 | 6.5 | |
| TC (Nos./100mL) | 3 | 0 | 1 | 0 | 0 | 97.72 | 0 |
| FC (Nos./100mL) | 0 | 0 | 0 | 0 | 0 | 99.65 | 0 |
| Total Chlorine (mg/L) | 0.3 | 0 | 0 | 0.1 | 0.01 | 99.25 | 4 |
| In table 1, table 2 and table | |||||||
| Sample Location | Water Quality Index Value | Category of Water |
| RO Unit 1 | 124.84 | Poor Water |
| RO Unit 2 | 128.42 | Poor Water |
| RO Unit 3 | 122.38 | Poor Water |
| RO Unit 4 | 131.26 | Poor Water |
| Sample Location | Water Quality Index Value | Category of Water |
| RO Unit 1 | 28.8 | Excellent Water |
| RO Unit 2 | 29.1 | Excellent Water |
| RO Unit 3 | 28.2 | Excellent Water |
| RO Unit 4 | 29.7 | Excellent Water |
| reading | Power consumption (kWh) | Water production (liter) | |
| 7/4/2019 | 60.5 | ||
| 14/4/2019 | 63.2 | 2.7 | 274 |
| 28/4/2019 | 64.5 | 1.3 | 93 |
| 30/5/2019 | 70.1 | 5.6 | 568 |
| 23/6/2019 | 74.1 | 4 | 400 |
| 30/6/2019 | 75.9 | 1.8 | 180 |
| 10/7/2019 | 78.1 | 2.2 | 214 |
| 17/7/2019 | 79.7 | 1.6 | 161 |
| 24/7/2019 | 81.7 | 2 | 174 |
| 31/7/2019 | 83.4 | 1.7 | 172 |
| 7/8/2019 | 85 | 1.6 | 161 |
| 14/8/2019 | 86.9 | 1.9 | 182 |
| 21/8/2019 | 89.3 | 2.4 | 246 |
| 30/8/2019 | 91.3 | 2 | 193 |
| 8/9/2019 | 93.1 | 1.8 | 172 |
| 15/9/2019 | 95 | 1.9 | 181 |
| 22/9/2019 | 97.3 | 2.3 | 228 |
| 30/9/2019 | 99.4 | 2.1 | 206 |
| 6/10/2019 | 101.3 | 1.9 | 171 |
| 13/10/2019 | 105.5 | 4.2 | 426 |
| 20/10/2019 | 108.2 | 2.7 | 218 |
| 30/10/2019 | 110.3 | 2.1 | 206 |
| 17/11/2019 | 113.5 | 3.2 | 328 |
| 30/11/2019 | 116.2 | 2.7 | 294 |
| 3/12/2019 | 117.5 | 1.3 | 131 |
| c) Power Consumption and Water Production of RO | ||||
| unit (Planning and Engineering Building) | ||||
| To observe how much electricity is consumed | ||||
| and its cost, an electricity meter was set with an RO | ||||
| filter. The meter reading, power consumption and water | ||||
| production data are shown in Table 6. Ten months data | ||||
| was collected here. By subtracting the meter reading, | ||||
| power | consumption | was | determined. | Power |
| consumption of RO units depends on the water demand | ||||
| or water production. | ||||
| Price of Slab | Per unit cost |
| 0 to 50 unit | Tk. 3.50 |
| 0 to 75 unit | Tk. 4 |
| 76 to 200 units | Tk. 5.45 |
| 201 to 300 units | Tk. 5.70 |
| 301 to 400 units | Tk. 6.02 |
| 401 to 500 units | Tk. 9.30 |
| Above 600 units | Tk. 10.70 |
| Month | Apr | May | June | July | Aug | Sept | Oct | Nov | Dec | Jan | Feb |
| Power | |||||||||||
| consumption | 4 | 5.6 | 5.8 | 7.5 | 7.9 | 8.1 | 10.9 | 5.9 | 7.5 | 7.4 | 8.1 |
| (kWh) | |||||||||||
| Water | |||||||||||
| production | 367 | 568 | 580 | 721 | 782 | 787 | 1021 | 602 | 734 | 703 | 864 |
| (liter) | |||||||||||
| Cost | |||||||||||
| (tk.) | 14 | 19.6 | 20.3 | 26.2 | 27.6 | 28.3 | 38.1 | 20.6 | 25.1 | 25.8 | 28.3 |
| Comment on RO treated water | Water quality Rating |
| Very Satisfied | 5 |
| Satisfied | 4 |
| Neutral | 3 |
| Dissatisfied | 2 |
| Very dissatisfied | 1 |