1. Introduction
ormaldehyde is produced in industrial scale from methanol. It uses atmospheric pressure to perform the production. There are steps in formaldehyde production. The first step involves the liquid methanol which vapourized into an air stream while steam was added to the resulting gaseous mixture. Also, the other step involves the gaseous mixture lead over a catalyst bed. The methanol was finally converted to formaldehyde through partial dehydrogenation and partial oxidation. (Alfaree & Adnan, 2016).
Besides, the report by Welch shows that 10 million of formaldehyde was produced annually and met the demand of the industries as at then, but as population increases, the demand of formaldehyde was increased and the production rate was not able to met industrial scale based on its wide application. (Alzein & Nath, 2018), the process industry would need more of formaldehyde production rate to met world production annually. This increase in population that occurs result to more production of formaldehyde at a later year. In the 2012, the production of formaldehyde amount to 32.5 million tons per year. According to (Sukunya et al., 2014), this increase in demand was due to the applications of formaldehyde in chemical synthesis such as resin products. These resins are used for polywood production. Also, formaldehyde solution can destroy bacteria and fungi.
However, the 32.5 million tons per year was a report as at 2012, but we are now in 2019. This has resulted to increase in population of the world as well as the demand for formaldehyde base on its usage in process industries. (Cameroon et al., 2019).
Today, many researchers are looking for new areas in which formaldehyde can be applied, technology has increase and new methods are been discovered. (Chauvel & Lefebvre, 2015),The production based on report cannot met the demand today and so more researchers are to go into designing of units operations for the production of formaldehyde to met world demand which as a results of the current population density. Also, more processes for the production of formaldehyde can be added to the existing two processes and hence these calls for more future research to be carried out with a view of which production process gives the most yield with the least cost of production. (Chouldhary et al., 2017).
The study of formaldehyde plant calls for new design of reactor that would produce formaldehyde in excess in other to take care of the world's population that requires the uses and applications of formaldehyde. The production of formaldehyde using the silver contact process amounts to 80% of total formaldehyde process. The type of reactor determines the desired productions which depend on feed quality (Antonio et al., 2010; and the reactor temperature . The work focus on the type of reactor design would produce formaldehyde in excess as to met the current demand of society today. This is base on the wide application of formaldehyde. The study require the development of design parameters or sizes of continuous stirred tank, plug flow and batch reactor for the two routes used in producing formaldehyde. The reactor types would be tested in its design to compute and simulate to ascertain which reactor type would be suitable to produce formaldehyde in the required quantity to supply to the needs of the process industry for various applications.
Besides, the various reactor models would be tested with the reaction mechanisms and kinetics for simulations of variables which would be used to ascertain the reactor that best give the highest production. The products from the reactors are fed into absorber to form formaldehyde 37% by mass called formalin or more (Andre et al., 2002).
However, the formalin formed at room temperature was not stable and formed paraformaldehyde. The paraformaldehyde formed was high concentration of formaldehyde. But formalin has methanol of 1.14% by mass for more stability in solution and its temperature was more than 313k , the study focuses on the design of reactor types for the production of formaldehyde. This formaldehyde has the formula HCHO and the first series of aliphatic aldehyde which was discovered in 1859. The production of formaldehyde which started during the twentieth century had continued even till date. The study becomes more imperative for industries, engineers and producers who wants to exploits the opportunity to design reactor types for the production of formaldehyde.
Also, the study calls for new design of reactor that would produce formaldehyde in excess in other to take care of the world's population that requires the uses and applications of formaldehyde. (Ghanta et al., 2017), the production of formaldehyde using the silver contact process amounts to 80% of total formaldehyde process. The type of reactor determines the desired product which depend on feed quality (Antonio et al., 2010;, Their work focus on the type of reactor design would produce formaldehyde in excess as to met the current demand of society today. This is base on the wide application of formaldehyde. The study require the development of design parameters or sizes of continuous stirred tank, plug flow and batch reactor for the two routes used in producing formaldehyde. (Ghaza & Mayourian, 2014),The reactor types would be tested in its design to compute and simulate to ascertain which reactor type would be suitable to produce formaldehyde in the required quantity to supply to the needs of the process industry for various applications. (Gujarathi et al., 2020), the various reactor models would be tested with the reaction mechanisms and kinetics for simulations of variables which would be used to ascertain the reactor that best give the highest production. The products from the reactors are fed into absorber to form formaldehyde 37% by mass called formalin or more (Andre et al., 2002). However, the formalin formed at room temperature was not stable and formed paraformaldehyde. The paraformaldehyde formed was high concentration of formaldehyde.
But formalin has methanol of 1-14% by mass for more stability in solution and its temperature was more than 313 k (Geoffrey et al., 2009). The study focuses on the design of reactor types for the production of formaldehyde. This formaldehyde has the formular HCHO and the first series of aliphatic aldehyde which was discovered in 1859. The production of formaldehyde which started during the twentieth century had continued even till date. The study becomes more imperative for industries, engineers and producers who wants to exploits the opportunity to design reactor types for the production of formaldehyde.
The production and optimization of formaldehyde can include the streams for air, methanol and water in a suitable composition in a plug flow reactor under certain conditions of temperatures and pressure (Andreasen et al., 2003). The purpose of using a plug flow reactor is to get desired product which can be optimized to get best yield of formaldehyde (Antonio et al., 2010;. (Lauks et al., 2015), on the other hand, when the production of formaldehyde involves the use of silver catalyst, the operation is carried out adiabatically by lagging the system which helps to obtain a selectivity of 90%. (Marton et al., 2017), the life of the catalyst is short depending on the impurities in the methanol and the gases at exist that contain considerable amount of hydrogen and water. However, the silver being a metal would have low catalytic activity for the decomposition of methanol even at a very high temperature. (Mazanec et al., 2019), the chemisorption of the monoatomic oxygen in the metal brings its activation. (Meisong, 2015), thermal decomposition of formaldehyde depends on the gas stream, the gas stream is cooled when it passes through the catalyst. The formaldehyde produced is then absorbed in an absorber by water to get pure formaldehyde. Since the gaseous form of formaldehyde is unstable, it is better absorbed in water. (Mohamad, 2016), the products of reaction contains the formaldehyde diluted in water other gases which mainly contains nitrogen. Finally, the commercial and final product is obtain from the absorber of about 55% weight of formaldehyde in water or formalin. (Mohsenzadeh, 2019), the design and optimization of the reactor for the production of formaldehyde which uses two different routes and each would be considered during the design of the reactor because we want to know which of the route would be best in the production of formaldehyde. Also, the reactors would be batch, continuous stirred tank and plug flow reactor. Each reactor would follow both routes
2. b) Methods
The methods that will be adopted in this Research includes: Material balance are the basics of process design. A material balance taken over the complete process will determine the quantities of raw materials required and products produced. Balances over individual process unit set the process stream flows and compositions. A good understanding of material balance calculations is essential in process design.
Material balances are also useful tools for the study of plant operation and trouble shooting. They can be used to check performance against design; to extend the often limited data from the plant instrumentation; to check instrument calibrations and to locate source of material loss.
The loss of mass associated with the production of energy is significant only in nuclear reactions. Energy and matter are always considered to be separately conserved in chemical reactions.
[???????????????? ??????] = [?????????????????? ????] + [????????????????????] ? [??????????????????????] ? [????????????????????????]For steady state process the accumulation term will be zero except in nuclear process, mass is neither generated nor consumed; but if a chemical reaction take place a particular chemical species may be formed or consumed in the process. If there is no chemical reaction the steady state balance reduces to:
[Materials in] = [Materials Out]3. (b) Energy Balance
A general energy balance equation can be written as:
? ???????? ???? ?????????????? ???? ???????????? ? = ? ???????? ???? ???????????? ???? ???????????? ? + ? ???????? ???? ???????????????????? ???? ???????????? ? ? ? ???????? ???? ?????????????????????? ???? ???????????? ? ? ? ???????? ???? ???????????????????????? ???? ???????????? ? If no chemical reaction occurs ? ???????? ???? ?????????????????????? ???? ???????????? ? = ? ???????? ???? ???????????????????? ???? ???????????? ? = 0 Equation (3) becomes ? ???????? ???? ?????????????? ???? ???????????? ? = ? ???????? ???? ???????????? ???? ???????????? ? ? ? ???????? ???? ???????????????????????? ???? ???????????? ?If the system is a steady state process
? ???????? ???? ???????????????????????? ???? ???????????? ? = 0 Equation (5) becomes ? ???????? ???? ???????????? ???? ???????????? ? = ? ???????? ???? ?????????????? ???? ???????????? ?Energy flow for each stream shall be computed in terms of Heat Flow using the formula
?? ? = ????? ?? ???????? ??? ? ?? ?????? ? Where ?? = ???????? ???????? ???????? ???? ????/??? ???= ???????? ???????? ???????? ???? ????/??? ? © 2021 Global JournalsDesign and Economic Analysis of a Small Scale Formaldehyde Plant from Flared Gas
The general conservation equation for any process can be written as: required for the production of formaldehyde and the optimization of each routes of production and in each of the reactor types. Finally, the physical properties would be presented in tabular form below (Reuss et al., 2003). Jaja et al, (2020), Methane is a major component of flared gas as well as natural gas and its composition varies from 70 to 90% in both cases.
(3)
(2) (1) (4) (5) (6) (7) (8)4. Global Journal of Researches in Engineering
5. (d) Mechanical Design
A vessel must be designed to withstand the maximum pressure to which it is likely to be subjected in operation. For vessels under internal pressure, the design pressure is normally taken as the pressure at which the relief device is set. This will normally be 5 to 10 per cent above the normal working pressure, to avoid spurious operation during minor process upsets. When deciding the design pressure, the hydrostatic pressure in the base of the column should be added to the operating pressure if significant.
Vessels subject to external pressure should be designed to resist the maximum differential pressure that is likely to occur in service. Vessels likely to be subjected to vacuum should be designed for a full negative pressure of 1 bar unless felted with an effective and reliable vacuum breaker.
6. (e) Cost Estimation and Economic Evaluation
Economic evaluation is very important for the proposed plant. We have to be able to estimate and decide between either native design and for project evaluation. Chemical plants are built to make profit and estimate of the investment is required and the cost of production are needed before the profitability for a project is the sum of the fixed and working capital.
Fixed capital is the total cost of the plant ready to start up. It is the cost paid to the contractors. Working capital is the additional investment needed, over and above the fixed capital to start up the plant and operate it to the point when income is earned. Most of the working capital is recovered from at the end of the project. The full detail of the costing is given in the appendix.
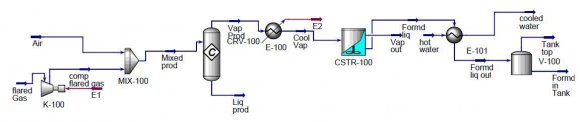
III. Design Simulation (Hysys) This section represents a process simulation of plant design for the production of Formaldehyde from flared gas. The simulation covers the following equipments/units: Figure 1 shows the full PFD of the Hysys design Simulation Where formaldehyde from flared gas using the reaction between absorbed methane gas from flared gas and oxygen. The procedure begins with compressing of flared gasses using a compressor. The component of interest being methane is being compressed and mixed with air stream inside a mixer and then sent to a conversion reactor where reaction of methane and oxygen occurs to Formaldehyde, Carbon [iv] oxide and water as products. The overhead products from the conversion reactor is being cooled and sent to a Continuous Stirred Tank Reactor [CSTR] for further reaction and more yield of the formaldehyde.
The product from the CSTR is being sent to the heat exchanger for further hitting to the desired temperature and subsequently sent to the storage tank Year 2021
( D D D D ) Cfor storage. The process was able to convert about 90% of methane and the yield of Formaldehyde is up to 45% making the process very economical to set up a plant for the production process using flared gas and trapping methane as base component of reaction. This is a new innovation in the technology of the production The following results of material balance with manual calculation compared with Hysys simulation is presented in tables below for each unit.
7. Streams
Manual calc. Hysys Simulation % Deviation In Table 4.1 above the mass flow rate of Flared Gas Stream (S 1 ) for Hysys simulation is 1.2 x 10 4 kg/hr while that for the manual calculation is 1.23 x 10 4 kg/hr with a deviation of 2.5%. the molar flow rate for Hysys simulation was found to be 600.10 kgmole/hr while that of manual calculation is 600.50 kgmole/hr with a deviation of 0.7% we also observe that since this unit is a single input, single output stream and applying the principles of conservation of mass, input mass equals output mass, hence the output been Compressed Flared Gas has the same mass and molar flow rates of the input stream which is Flared Gas as well as the same deviation.
8. Streams
Manual calc.
9. Hysys Simulation % Deviation
Air (S 3 ) Mass Flow (kg/hr) 1.1 x 10 In Table 4.2 above the mass flow rate of the Air Stream is 1 x 10 4 kg/hr for Hysys simulation while for manual calculation is found to be 1.1 x 10 4 kg/hr having a deviation of 10%. The molar flow rate for the Hysys simulation is 343.3 kgmole/hr while that of the manual calculation is 343.3 kgmole/hr having a deviation of 0.9%. This Flared Gas stream has been stated in the discussion of Table 4.1, however we are to note that Air stream (S 3 ) and Flared Gas Stream (S 2 ) are both input streams respectively which are mixed inside a mixer to produce an outlit stream Mixed Product (S 4 ) having a mass flow rate of 2.20 x 10 4 kg/hr for Hysys simulation and 2.10 x 10 4 kg/hr for manual calculation with a 4.5%. the molar flow rate of this stream is 947.10 kgmole/hr for Hysys simulation and 947.40 for manual calculation with a deviation of 3%. Applying the principles of conservation of mass to this unit shows that if mass flow rates of the inlet streams are added together the results equals the mass flow rate of the outlet stream which makes our results to be valid for inflow of mass is equal to outflow of mass. In Table 4.3 the mass flow rate of the Mixed Product Stream (S 4 ) for Hysys simulation is 2.20 x 10 4 kg/hr while the manual calculation is 2.10 x 10 4 kg/hr with deviation of 4.5%. The molar flow rate of the Mixed Product Stream (S 4 ) is 947.10 kgmole/hr for Hysys simulation and 947.40 kgmole/hr for manual calculation with a deviation of 3.0%. We also observe that since this unit is a single input, single Output Stream and applying the principles of conversation of mass, input mass equals output mass, hence the output been Vapour Product (S 5 ) has same mass and molar flow rates of the Input Stream as well as the same % Deviation. Also the Extent of Reaction for this unit for Hysys simulation is 24.27. The fractional conversion for Hysys simulation is 0.1102 while for manual calculation is 0.1105.
10. Streams
11. Streams
12. b) Energy Balance Results
The following results of energy balance with manual calculation compared with Hysys simulation is presented in tables below for each unit.
13. Streams
Manual calc. Hysys Simulation % Deviation In Table 4.8 it is observed that the heat flow of the air stream is zero because the temperature of this stream equals its reference temperature hence no heat flow. Also the heat flow of Compressed Gas Stream (S 2 ) and Mixed Stream (S 4 ) are equal.
14. Streams
Manual calc. Hysys Simulation % Deviation
In Table 4.9 above the flow of Mixed Stream (S 4 ) and Vapour Product Stream (S 5 ) are equal since it is a Single Input, Single Output Stream and also in with the principles of conservation of energy. In Table 4.11 the sum of the heat flow Formaldehyde Liquid Stream (S 7 ) and Hot Water Inlet Stream (S 10 ) equals to the sum of the heat flow of Formaldehyde Liquid Out Stream (S 9 ) and Water Stream (S 11 ) which is in line with the principles of conservation of energy which states that inflow of energy is equal to outflow of energy provided that the system is a steady state process and no chemical reaction occurs. In Table 4.12 the design parameters such as Column Height, Column Diameter, Cross-sectional Area, Volume, Space time, Space Velocity, Thickness and Corrosion Allowance was compared with Hysys simulation and Manual calculation and the maximum deviation was found to be 3.2%.
15. Streams
16. b) Design /Sizing Results
The equipment design and sizing of each equipment of the plant is presented in the table below, for manual calculation compared to Hysys Simulation. In Table 4.15 Heat Exchanger Design Parameter was compared between Hysys simulation and manual calculation and the maximum deviation was found to be 0.2%
17. V. Sensitivity Analysis
The functional parameters such as length of Reactor, Diameter, Space time, Space velocity were studied to see how they change with conversion and are presented in figures -to C Figure 1 demonstrates the profile variation of length of the reactor varying with conversion. The results in the profile gives an increase of the length of reactors value with conversion increase. The length of reactor values increased from 0 m to 0.76m due to increase in conversion from 0 to 0.9. the increase in length resulted to increase in volume of the reactor and decrease in the rate of reaction values. The volume of the reactor is a function of length and rate of reaction.
18. b) Diameter of Reactor with Conversion
Similarly, figure 2 demonstrates the variation of the diameter the variation of the diameter of the reactor for the production of formaldehyde with conversion. The relationship is such that the length increases with increase in conversion and results to values such that when D=0, X A =0 and D=0.27m, X A =0.9. since the volume of reactor increases, the length and diameter of the reactor too increases to achieved the production of ethylene oxide and proper sizing of the reactor. 3 depicts the variation of space time of reactor varying with conversion. The profile of the space time is exponentially increasing with conversion starting from 05-0.035hr when X A =0-0.9 respectively. Space time is defined as the time taken for one reactor feed volume converted to product. From the results, the space time values are very small meaning the reaction is a fast one. Increasing the space time values, leads to increase in the value of the reactor and higher yields of the product formed. Figure 4 shows the graph of space velocity varying with conversion. The universe of space time gives the space velocity's values. The space velocity's values are higher and increases from 0-600hr -1 when conversion increases too from 0-0.1 and then drops exponentially from 600-10hr -1 when conversion increases from 0.1-0.9.The space velocity should be reduced to achieve higher yield at lower cost as shown from the profile plot.
19. c) Space Time with Conversion
20. d) Space Velocity with Conversion
21. e) Volume of Reactor with Conversion
22. VI. Conclusion
The design of a 10,000 ton/yr Formaldehyde plant has been executed. The design considered first the material balance of the plant using the principles of conservation of mass which states that for steady state process the inflow of mass equals the outflow of mass, hence the mass balance of each unit/equipment was extensively evaluated, the principles of conservation of energy which states that outflow of energy equals inflow of energy for a steady state process was applied to evaluate the flow of energy for each stream. The design also considered other aspect such as equipment sizing/design specification, mechanical design, costing and economic evaluation, instrumentation and process control, layout, safety and environmental consideration and finally Hysys design simulation. Comparison of the material balance results between manual calculation and Aspen Hysys simulation and the highest difference was 0.8% for the energy balance result the difference between the manual calculation and Aspen Hysys simulation was 0.5% for the sizing results, the highest difference between the manual calculation and Aspen Hysys simulation was 0.3%.
Mechanical design to determine the thickness of vessels to withstand pressure was also considered as we as adding corrosion allowance. A detailed cost estimation and economic evaluation was analyzed to determine the profitability of the plant before setting up and it is given in the appendix.
| 4 | 1 x 10 4 | 10 |
| Manual calc. | Hysys Simulation | % Deviation | |
| Vapour Product (S 5 ) | |||
| Mass Flow (kg/hr) | 2.10 x 10 4 | 2.20 x 10 4 | 4.5 |
| Molar Flow (kgmole/hr) | 947.40 | 947.10 | 3.0 |
| Cooled Vapour (S 6 ) | |||
| Mass Flow (kg/hr) | 2.10 x 10 4 | 2.20 x 10 4 | 4.5 |
| Molar Flow (kgmole/hr) | 947.40 | 947.10 | 3.0 |
| In Table 4.4 the mass flow rate of the input | same for the cooled Vapour Stream (S 6 ) which is 2.2 x | ||
| stream Vapour Product has been stated in the | 10 4 kg/hr for Hysys simulation and 2.10 x 10 4 kg/hr for | ||
| discussion of Table 4.3, this unit contains a single input, | manual calculation. Also the molar flow is 947.10 for | ||
| single output streams. Hence, the same mass and | Hysys simulation and 947.40 for manual calculation. | ||
| molar flow rate of the Vapour Product Stream (S 5 ) is the | |||
| Streams | Manual calc. | Hysys Simulation | % Deviation |
| Cooled Vapour (S 6 ) | |||
| Mass Flow (kg/hr) | 2.10 x 10 4 | 2.20 x 10 4 | 4.5 |
| Molar Flow (kgmole/hr) | 947.40 | 947.10 | 3.0 |
| Formaldehyde Liquid (S 7 ) | |||
| Mass Flow (kg/hr) | 888.5 | 888.7 | 0.2 |
| Molar Flow (kgmole/hr) | 45.04 | 45.03 | 0.3 |
| Year 2021 |
| 30 |
| XXI Issue I Version I |
| Volume |
| D D D D ) C |
| ( |
| Journal of Researches in Engineering |
| Global |
| Flared Gas (S 1 ) | |||
| Temperature (?) | 25 | 25 | 0.0 |
| Pressure (kpa) | 101.3 | 101.3 | 0.0 |
| Heat Flow (kJ/hr) | -4.682e7 | -4.686e7 | 4.7 |
| (E1) | |||
| Temperature (?) | - | - | |
| Pressure (kpa) | - | - | |
| Heat Flow (kJ/hr) | 3.421e5 | 3.427e5 | 1.4 |
| Compressed Gas (S 2 ) | |||
| Temperature (?) | 38.84 | 38.84 | 0.0 |
| Pressure (kpa) | 120 | 120 | 0.0 |
| Heat Flow (kJ/hr) | -4.6479e7 | -4.6478e7 | 1.3 |
| In Table 4.7 above the heat flow of Stream (S 1 ) | Conservation of Energy for a steady state process with | ||
| and Stream (E1) when added equals the heat flow of | chemical reaction occurring. | ||
| stream (S 2 ) and this is in line with the principles of | |||
| Streams | Manual calc. | Hysys Simulation | % Deviation |
| Compressed Gas (S 2 ) | |||
| Temperature (?) | 38.84 | 38.84 | 0.0 |
| Year 2021 |
| 31 |
| XXI Issue I Version I |
| Volume |
| D D D D ) C |
| ( |
| of Researches in Engineering |
| Global Journal |
| Manual calc. | Hysys Simulation | % Deviation | |
| Vapour Product (S 5 ) | |||
| Temperature (?) | 34.84 | 34.84 | 0.0 |
| Pressure (kpa) | 101.3 | 101.3 | 0.0 |
| Heat Flow (kJ/hr) | -4.6478e7 | -4.6478e7 | 5.4 |
| (E 2 ) | |||
| Temperature (?) | - | - | |
| Pressure (kpa) | - | - | |
| Heat Flow (kJ/hr) | 2.636e7 | 2.636e7 | 0.0 |
| Cooled Vapour (S 6 ) | |||
| Temperature (?) | 800 | 800 | 0.0 |
| Pressure (kpa) | 101.3 | 101.3 | 0.0 |
| Heat Flow (kJ/hr) | -7.283e7 | -7.285e7 | 2.4 |
| In table 4.10 the sum of the Heat Flow of Stream | Product Stream (S 5 ) which is line with the principles of | ||
| E2 and cooled Vapour Stream equals that of Vapour | conservation of energy. | ||
| Streams | Manual calc. | Hysys Simulation | % Deviation |
| Cooled Vapour (S 6 ) | |||
| Temperature (?) | 800 | 800 | 0.0 |
| Pressure (kpa) | 101.3 | 101.3 | 0.0 |
| Heat Flow (kJ/hr) | -7.283e7 | -7.285e7 | 2.4 |
| Formaldehyde Liquid (S 7 ) | |||
| Year 2021 |
| 32 |
| XXI Issue I Version I |
| Volume |
| D D D D ) C |
| ( |
| Journal of Researches in Engineering |
| Global |
| Streams | Manual calc. | Hysys Simulation % Deviation | |
| Formaldehyde Liquid (S 7 ) | |||
| Temperature (?) | 80 | 80 | 0.0 |
| Pressure (kpa) | 101.3 | 101.3 | 0.0 |
| Heat Flow (kJ/hr) | -1.169e7 | -1.167e7 | 3.0 |
| Formaldehyde Liquid Out (S 9 ) | |||
| Temperature (?) | 120 | 120 | 0.0 |
| Pressure (kpa) | 101.3 | 101.3 | 0.0 |
| Heat Flow (kJ/hr) | -1.154e7 | -1.156e7 | 3.6 |
| Hot Water Inlet (S 10 ) | |||
| Temperature (?) | 200 | 200 | 0.0 |
| Pressure (kpa) | 101.3 | 101.3 | 0.0 |
| Heat Flow (kJ/hr) | -1.160e7 | -1.162e7 | 3.2 |
| Cooled Water Outlet (S 11 ) | |||
| Temperature (?) | 195 | 195 | 0.0 |
| Pressure (kpa) | 101.3 | 101.3 | 0.0 |
| Heat Flow (kJ/hr) | -1.175e7 | -1.174e7 | 1.4 |
| Design/Sizing Item | Hysys Simulation | Manual Calculation % Deviation | ||
| Flow Type | ||||
| Materials of Construction | Stainless steel | Stainless steel | ||
| Column Height | 3.86 | 3.84 | 2.4 | |
| Column Diameter | 2.57 | 2.54 | 5.3 | |
| Cross Sectional Area | 5.18 | 5.17 | 5.6 | |
| Volume | 20 | 21 | 4.8 | |
| Space Time | 0.43 | 0.42 | 2.3 | |
| Space Velocity | 2.32 | 2.34 | 6.3 | |
| Thickness | 18.63 | 18.65 | 3.1 | |
| Corrosion allowance | 2.00 | 2.00 | 0.00 | |
| In Table 4.13 the design parameters such as | simulation and Manual calculation and the maximum | |||
| Column Height, Column Diameter, Cross-sectional Area, | deviation was found to be 6.3%. | |||
| Volume, Space time, Space Velocity, Thickness and | ||||
| Corrosion Allowance was compared with Hysys | ||||
| Design/Sizing Item | Hysys Simulation | Manual Calculation | % Deviation | |
| Flow Type | ||||
| Materials of Construction | Stainless steel | Stainless steel | ||
| Column Height (m) | 5.54 | 5.56 | 0.36 | |
| Column Diameter(m) | 3.72 | 3.71 | 1.40 | |
| Cross Sectional Area(m 2 ) | 10.80 | 10.79 | 1.30 | |
| Volume(m 3 ) | 60.02 | 60.00 | 3.30 | |
| Space Time(hr) | 0.74 | 0.75 | 1.33 | |
| Space Velocity(hr -1 ) | 1.35 | 1.33 | 6.06 | |
| Thickness(mm) | 21.60 | 21.59 | 1.67 | |
| Corrosion allowance(mm) | 2.00 | 2.00 | 0.00 | |
| In Table 4.14 the design parameters such as | Corrosion Allowance was compared with Hysys | |||
| Column Height, Column Diameter, Cross-sectional Area, | simulation and Manual calculation and the maximum | |||
| Volume, Space time, Space Velocity, Thickness and | deviation was found to be 6.06%. | |||
| Design/Sizing Item | Hysys Simulation | Manual Calculation | % Deviation | |
| Equipment Name | Shell and tube heat exchanger | Shell and tube heat exchanger | ||
| Objective. | Cooling the reactor effluent | Cooling the reactor effluent | ||
| Equipment Number | U-007 | U-007 | ||
| Designer | ||||
| MUESI NOBLE PG.2017/02618 MUESI NOBLE PG.2017/02618 | ||||
| Type | Split ring floating head (two shell | Split ring floating head (two shell | ||
| four tubes) | four tubes) | |||
| Utility | Brackish Water | Brackish Water | ||
| Insulation | Foam Glass | Foam Glass | ||
| Heat load Q (kw) | 945 | 947 | 0.0 | |
| Heat transfer Area (m 2 ) | 53.4 | 53.5 | 0.2 | |
| LMTD (°C) | 32 | 32.1 | 0.2 | |
| U (W/m 2 K) | 640 | 640.3 | 0.1 | |
| Inlet temperature) °C) | 80 | 80 | 0.0 | |
| Shell Diameter (mm) | 476 | 476 | 0.0 | |
| Shell coefficient W/m 2 C | 1516 | 1516.4 | 0.2 | |
| Outlet temperature (°C) | 40 | 40 | 0.0 | |
| Baffle spacing (25% cut) | 95.2 | 95.2 | 0.0 | |
| Shell material | Carbon steel | Carbon steel | ||
| Inlet temperature (°C) | 25 | 25 | 0.0 | |
| Tube Diameter | (mm | 0.0 | ||
| od/id) | 20/16 | 20/16 | ||
| Tube length (m) | 4.83 | 4.83 | 0.0 | |
| Pitch type | Triangular | Triangular | ||
| Outlet temperature (°C) | 40 | 40 | 0.0 | |
| Number of Tubes | 172 | 172.2 | 0.0 | |
| Tube material | Carbon alloy | Carbon alloy | ||
| Pitch | 25mm | 25mm | 0.0 | |