1. Identification of Dominant Shape Characteristic
for Particle Packing Models using an Imaging Technique for Aggregates Madhuri N. Mangulkar ? , Sudddhasheel Ghosh ? & Sanjay S. Jamkar ? Abstract-Aggregates occupy most of the volume of concrete.
A proper packing of aggregates with binding material ensures reduction in voids and thereby better performance of concrete.
A good packing of the aggregates in a mix can be achieved by filling up the void space left by large or coarse aggregates by the finer aggregates, followed by standard process of compaction. Therefore, precise evaluation of characteristics of ingredients of concrete is highly essential. Various mathematical models for studying concrete mix proportions have been proposed in the literature. Most of these models have remained restricted to studying spherical or nearspherical particles. Therefore there is a need to understand whether there is a possibility of extending the existing theories to non-spherical particles also. The paper also presents the development of Digital Image Processing (DIP) based system for the measurement of volume, equivalent volume diameter, sphericity, roundness index of coarse aggregate particles. The system is calibrated using standard objects such as marbles, coins and then used for the measurement of coarse aggregate particles having varied characteristics. The dimensions of the aggregates i.e. the longest, the intermediate and the shortest dimensions and obtained using mathematical morphological operations. A detailed analysis of the various shape characteristics shows that sphericity is the most effective measure. The authors are currently working in the direction of extending the mathematical model using this shape characteristic.
2. Introduction
ggregates occupy bulk of the volume of concrete. Their characteristics such as size, grading, shape and texture have significant effect on the properties of concrete in both fresh and hardened state. The effect is more significant in the case of high strength concrete. The properties of concrete such as strength, workability, cohesiveness and durability depend upon the properties of its constituents and their relative proportion in the mix.
Evolutions in concrete mix proportioning procedures are taking place since long. Particle packing theories have been under development to further refine the mix proportioning process. Particle packing models proposed by the researchers include (a) continuous, (b) analytical and (c) discrete element. Out of these, analytical particle packing models provide relatively better solution for concrete mix proportioning. The analytical model assumes that each class of particle will pack to its maximum density in the available volume. Theoretically, it gives the packing density of a mix based on particle size distribution and individual packing densities of various size fractions that are present in the distribution.
3. a) Research Significance
It is understood that the aggregate particles present in a concrete mix would interact based on their respective sizes and shapes. Our work is in the context of analytical modelling of this inter-particulate interaction. De Larrard [1] and Yu et al. [7] have attempted to model this interaction between the various aggregate particles in a mix, based on size fractions. Therefore, it is important to discuss the sizes and shapes of the aggregate particles and the consequent inter-particulate interactions. In this paper we describe a scanning system for aggregates, to identify the various shape descriptors, and choose the most effective one, and identify an effective modelling system based on the literature.
4. b) Estimation of packing density in a mix
De Larrard [2,3,4,5] has constrained his study on two types of aggregates namely rounded and crushed. In his study, the interaction between the coarse and fine particles in a concrete mix are modelled using the wall effect and loosening effect functions. These functions are finally used to determine the packing density in a concrete mix.
(1)
Where the function ???? ?? and ???? ?? represent the wall effect and the loosening effect respectively, and are given by the following equations.
(2)
(3) However, in reality, it is seen that aggregates are available in different shapes and sizes, see Figure 1. In their study, Yu et al. [7] had considered sphericity as an additional input to be given to the interaction function for the wall and loosening effects. The interaction functions proposed by Yu et al. [7,8] are given in the following equations.
(4) (5) where, ?? is defined as the ratio of equivalent packing diameters, with the value of ?? ranging between 0 and 1. The equivalent packing diameter ????, for a particular aggregate is given as: Therefore, it would be interesting to investigate whether the other measures can also contribute to improvising the modelling system for interaction.
? ? = ? ? 1-?[1 ? ? ? + ? ?? ? ? (1-1? ? )] ? ? -?[1-? ?? ? ? ? ? ] ? ? ? ?? = ? 1 ? (1 ? ? ? ? ? ) 1.02 ? ?? = 1 ? (1 ? ? ? ? ? ) 1.50 ?(?) = 1 ? (1 ? ?) 3.3 ? 2.8?(1 ? ?) 2.7 ?(?) = 1 ? (1 ? ?) 2.0 ? 0.4?(1 ? ?)5. c) Assessment of the shape and classification of aggregates
Several researchers have studied the shape and classified aggregates. These studies can be categorised into the following groups: (a) based on computer tomography, (b) based on laser scanning, and (c) based on camera based scanning. It is realised that computer tomography and laser scanning based techniques are difficult to be applied on the field, and are also expensive. Therefore, in this study camera based scanning techniques are discussed and implemented.
Most camera based study techniques developed till date use an arrangement that image the aggregate from two different sides to assess the longest, intermediate and the smallest sides of the minimal box containing the aggregate, represented as a triplet (????, ????, ????). However, a complete three dimensional picture of a complex shaped aggregate can be obtained only if it is imaged from multiple sides. Therefore, there is a need to develop a new system which can image an aggregate to obtain its precise dimensions.
6. d) Shape characteristics of an aggregate
The shape characteristics of an aggregate have been traditionally expressed in terms of sphericity, elongation, flatness and shape factor. The various formulae for determining these characteristics for a given triplet (dl, di, ds) are given in Table [1]. e) Research questions Based on the above discussions, we pose the following research questions for this paper: 1. Which is the most effective shape parameter for distinguishing various shapes of aggregates? 2. Can a system be designed which can image an aggregate from more than two sides? 3. Can the de Larrard's [4] CPM theory be extended to include more shapes of aggregates?
II.
7. Methodology
This section presents the design of a system for imaging various facets of aggregates, analysing the shapes of aggregates and the possible extension of de Larrard's [1] theory, in the light of the discussion and the questions proposed in the previous section. In order to measure the various characteristics of an aggregate, it is placed on the aggregate tray mounted on a conveyor. The conveyor arrangement moves the tray linearly to the first position (in front of bottom camera) where the first LED lamp illuminates the aggregate. The bottom camera captures the first image. The aggregate tray then moved to a second position on the turn table where a second image is captured by the top camera. The third camera at the front also captures an image simultaneously. It also captures images by turning the tray through 90, 180 and 270 degrees. The turntable rotates the tray by 270 degrees in opposite direction and conveyor brings it to the original position. The steps are repeated till the image acquisition of all the aggregate particles in the sample is completed.
The system is calibrated using standard objects of known dimensions such as coins, rectangular prisms and marbles. The dimensions of the objects are measured manually using standard vernier calliper. Digital images of these objects are acquired by placing the objects one at a time, at a distance of 10cm from each camera. Six images are taken at an interval of 5 seconds. Each camera in the system provided an image of dimensions 1600 pixels x 1200 pixels. The images are processed using MATLAB through the following steps: (a) conversion of RGB images to gray scale, (b) noise filtering, (c) detection of boundary, and (d) computation of longest (dl), intermediate (di), and shortest (ds) dimensions of the object. Based on the results, it is observed that 1600 pixels correspond to 62.4 mm i.e. 0.039 mm/pixel.
8. b) Analysis of shape characteristics
In this study, four different categories of aggregates are tested, viz. Elongated, rounded, angular and cylindrical. 30 aggregate pieces of each of the types are passed through the imaging arrangement (DIPAM), and the measurements of their longest, intermediate and shortest dimensions were obtained. In addition, the volumes of the respective aggregates were also found out using a measuring cylinder. To identify the shape characteristic that distinguishes the aggregates the most, a linear separability analysis is conducted.
9. c) Extension of the CPM theory
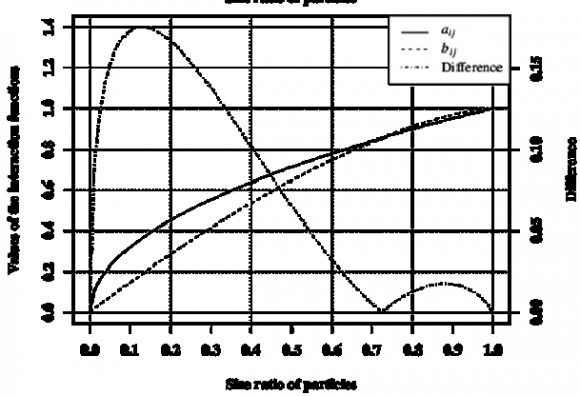
It was pointed out earlier that the CPM theory proposed by de Larrard [1,4] was limited to rounded and crushed aggregates. His theory proposes two activation functions, which have already been denoted by equations (1,2) and (3). The activation functions proposed by Yu et al. [6,7] consider the sphericity of the aggregates as an additional parameter. The activation functions proposed by de Larrard intersect with each other, see Figure 2. In his work, Fennis [8,9] points out that this intersection of the two function may cause problems in "scaling". Further, in the works proposed by de Larrard [1][2][3][4][5], Yu et al. [6,7] and Fennis [7,8], the curves for interaction function are convex. Thus, in this context, it might be said that (a) the interaction functions must not intersect with each other, (b) must be convex, and (c) must be inclusive of the shape parameters.
10. III.
11. Results and Discussion
12. a) Calculation of the shape parameters
Aggregates of different shapes and sizes were passed through the imaging system. The dimensions of each of the aggregates were obtained. Further, the volumes of each of the aggregates was also calculated. The shape parameters calculated for each of the types of aggregates are given in (as shown in Table 1).
13. b) Choosing the most distinguishing factor
It is seen from a separability analysis and also (as shown in Table 2), that sphericity is the most discriminating factor amongst all types of aggregates. Hence, in this study, sphericity is chosen. c) Choice of the interaction functions Both de Larrard and Yu et al. [6,7] have proposed interaction functions for modelling the interparticle interactions in the CPM theory. Furthermore, both the theories use particle size ratio ??. In contrast to de Larrard's approach where r is taken an a ratio of particle diameters, Yu et al [6,7] have represented r as a ratio of equivalent packing diameters, where they have considered sphericity as a shape factor. It was argued earlier, in this paper, that Fennis [8,9] objected to the interaction functions intersecting between the values or ?? = 0 and ?? = 1, where r denotes the particle size ratio.
14. Volume Xx XI Issue I V ersion I Global Journal of Researches in Engineering ( ) E
It is seen that the model of the interaction functions proposed by Yu et al [6,7] are mathematically simpler, and than the changes in the different coefficients and the exponents can change the shape of the function. Further, based on the respective choices, these functions may or may not intersect with each other. It remains to be investigated as to what could be these choices for coefficients and exponents.
IV.
15. Conclusion
In this work, we have presented the design of an imaging system, which improvises on the past imaging systems to give a more complete picture of the dimensions of an aggregate. The dimensions captured by the imaging system are analysed for shape characteristics of the aggregates. It was found that sphericity is the most prominent measure of shape amongst the four considered in this study. It was also seen that the model of interaction functions proposed by Yu et al [6,7] are more appropriate to extend the study of the CPM theory proposed by de Larrard [1][2][3][4][5]. The tuning of the coefficients and the exponents in the model of the Yu et al [6,7] remains to be seen and will be conducted by the authors in the future research work.
| FACTOR | FORMULA | REFERENCE |
| Shape factor | Barksdale et al.[10] | |
| Flatness | Barksdale et al.[10] | |
| Elongation | Kuo et al.[11] | |
| Sphericity | Kuo et al.[11] |
| AGGRE -GATE TYPE | SIEVE SIZE FRACTI O N IN MM | AVERAGE DIMENSIONS IN MM AS PER DIP LONGES T (DL) INTE-MEDIA TE (DI) SHORTEST (DS) | VOLUME IN MM 3 AS PER ARCHIM-EDES PRINCIPL E EQUIV-ALENT CYLINDER | EQUIVA-LENT ELONGATE D PRISM | PERCENTAGE ERROR IN VOLUME EQUIVA-LENT ELONGAT ED PRISM EQUIV-ALENT CYLIN-DER | EQUIVA-LENT DIAMETE R OF SPHERE (MM) | SHAPE MEASURES BY DIP SPHER -ICITY ELON-FLAT-SHAPE GATION NESS FACTOR RATIO RATIO | |||||||
| 1 | 2 | 3 | 4 | 5 | 6 | 7 | 8 | 9 | 10 | 11 | 12 | 13 | 14 | 15 |
| 4.75-6.3 16.10 5.40 | 4.30 | 300.00 | 293.61 | 186.92 | 71.20 | 8.99 | 8.25 | 0.45 | 0.46 | 2.98 | 3.74 | |||
| 6.3-10 16.69 10.75 | 6.31 | 850.00 | 889.39 | 566.20 | 48.36 | -5.55 | 11.93 | 0.62 | 0.47 | 1.55 | 2.64 | |||
| Type-A- | 10-12.5 20.57 10.75 | 8.71 | 1500.00 1513.54 | 963.55 | 55.67 | -0.89 | 14.25 | 0.60 | 0.59 | 1.91 | 2.36 | |||
| Elongat | ||||||||||||||
| ed | 12.5-16 27.40 12.75 | 10.88 | 3000.00 2983.87 1899.59 | 57.93 | 0.54 | 17.86 | 0.57 | 0.58 | 2.15 | 2.52 | ||||
| 16-20 43.70 23.00 | 12.50 | 8000.00 9867.55 6281.88 | 59.19 | 1.34 | 26.61 | 0.53 | 0.39 | 1.90 | 3.50 | |||||
| 20-25 30.10 23.30 | 14.00 | 8500.00 7711.53 4909.31 | 62.96 | 3.74 | 24.51 | 0.71 | 0.53 | 1.29 | 2.15 | |||||
| AGGRE -GATE TYPE | SIEVE SIZE FRACTIO N IN MM | AVERAGE DIMENSIONS IN MM AS PER DIP LONGES T (DL) INTER-MEDIA TE (DI) SHORTES T (DS) | VOLUME IN MM 3 AS PER ARCHIM-EDES PRINCIPL E EQUIV-ALENT CYLINDE R | EQUIVA-LEN T PYRAMID | PERCENTAGE ERROR IN VOLUME EQUIVA-LEN T PYRAMID EQUIV-ALENT CYLIN-DER | EQUIVA-LENT DIAMETE R OF SPHERE (MM) | SHAPE MEASURES BY DIP SPHER -ICITY ELON-FLAT-SHAPE GATION NESS FACTOR RATIO RATIO | |||||||
| 1 | 2 | 3 | 4 | 5 | 6 | 7 | 8 | 9 | 10 | 11 | 12 | 13 | 14 | 15 |
| 4.75-6.3 9.20 | 5.43 | 5.28 | 120.00 263.28 | 131.64 | -8.84 | -54.42 | 6.31 | 0.70 | 0.75 | 1.70 | 1.74 | |||
| 6.3-10 12.15 6.08 | 5.90 | 200.00 435.49 | 217.74 | -8.15 | -54.07 | 7.46 | 0.62 | 0.69 | 2.00 | 2.06 | ||||
| Type-B | 10-12.5 16.65 9.68 | 9.48 | 750.00 1526.32 763.16 | -0.41 | -50.21 | 11.34 | 0.69 | 0.75 | 1.72 | 1.76 | ||||
| Angular | 12.5-16 20.40 11.83 | 11.50 1350.00 2774.15 1387.07 | 0.21 | -49.89 | 13.84 | 0.69 | 0.74 | 1.73 | 1.77 | |||||
| 16-20 27.80 16.30 | 15.70 3000.00 7114.30 3557.15 | -15.66 | -57.83 | 18.94 | 0.69 | 0.74 | 1.71 | 1.77 | ||||||
| 20-25 31.25 19.65 | 18.85 5000.00 11575.08 5787.54 | -13.61 | -56.80 | 22.28 | 0.72 | 0.76 | 1.59 | 1.66 | ||||||
| AVERAGE DIMENSIONS IN MM AS PER DIP | VOLUME IN MM 3 AS PER | PERCENTAGE ERROR IN VOLUME | EQUIVAL- | SHAPE MEASURES BY DIP | |||||||||||
| AGGRE -GATE TYPE | SIEVE SIZE FRACTION IN MM | LONGE -ST (DL) | INTER-MEDIA TE (DI) | SHORTES T (DS) | ARCHI-MEDES PRINC-IPLE | EQUIV-ALENT CUBOID | EQUIVA-PRISM LENT ELON-GATED | EQUIVA-PRISM LENT ELON-GATED | EQUIVA-LENT CUBOID | ENT DIAMETE R OF SPHERE (MM) | SPHER -ICITY | SHAPE FACTO R | ELON-GATION RATIO | FLATNES S RATIO | |
| 1 | 2 | 3 | 4 | 5 | 6 | 7 | 8 | 9 | 10 | 11 | 12 | 13 | 14 | 15 | |
| 4.75-6.3 9.40 | 5.25 | 5.20 | 270.00 256.62 201.55 35.95 | 6.77 | 7.88 | 0.68 | 0.74 | 1.79 | 1.81 | ||||||
| Year 2021 | Type-C Cubical | 6.3-10 10-12.5 15.15 9.68 10.75 6.33 12.5-16 22.90 14.48 | 6.08 9.53 14.10 3500.00 4673.83 3670.82 -4.65 450.00 413.06 324.42 35.63 1500.00 1396.14 1096.52 38.62 | 6.52 8.87 -25.11 | 9.24 13.87 20.74 | 0.69 0.74 0.73 | 0.74 0.79 0.77 | 1.70 1.57 1.58 | 1.77 1.59 1.62 | ||||||
| 14 | 16-20 | 26.30 14.48 | 14.10 6000.00 5367.76 4215.83 55.37 | 22.02 | 21.72 | 0.67 | 0.72 | 1.82 | 1.87 | ||||||
| Volume Xx XI Issue I V ersion I | 20-25 | 30.10 18.28 | 17.80 8000.00 9791.38 7690.13 -85.70 | -88.77 | 26.54 | 0.71 | 0.76 | 1.65 | 1.69 | ||||||
| ( ) E | |||||||||||||||
| Global Journal of Researches in Engineering | |||||||||||||||
| © 2021 Global Journals | |||||||||||||||
| AVERAGE DIMENSIONS IN MM AS PER DIP | VOLUME IN MM 3 AS PER | PERCENTAGE ERROR IN VOLUME EQUIV- | SHAPE MEASURES BY DIP | |||||||||||
| AGGRE -GATE TYPE | SIEVE SIZE FRACTIO N IN MM | LONG-EST (DL) | INTER-MEDIA TE (DI) | SHORT-EST (DS) | ARCHIM-EDES PRINCIPL E | EQUIVA-LENT CYLINDE R | EQUIVA-LENT ELONGA-TED ELLIPSOI | EQUIVA-LENT ELONGA-TED ELLIPSOI | EQUIVA-LENT CYLINDER | ALENT DIAMET ER OF SPHERE (MM) | SPHER -ICITY | SHAPE FACTO R | ELON-GATIO RATIO N | FLATNES S RATIO |
| D | D | |||||||||||||
| 1 | 2 | 3 | 4 | 5 | 6 | 7 | 8 | 9 | 10 | 11 | 12 | 13 | 14 | 15 |
| 4.75-6.3 7.82 5.83 | 4.75 | 100.00 | 379.38 151.752 | -34.10 | 163.59 | 8.98 | 0.84 | 0.70 | 0.90 | 1.36 | ||||
| 6.3-10 | 8.40 9.30 | 6.18 | 300.00 1312.14 524.856 | -42.84 | 128.63 | 13.58 0.87 | 0.68 | 0.99 | 1.47 | |||||
| Type-D | 10-12.5 13.45 12.60 9.13 | 750.00 2120.68 848.24 | -11.59 | 253.66 | 15.94 0.88 | 0.69 | 1.00 | 1.46 | ||||||
| Rounde | ||||||||||||||
| d | 12.5-16 15.83 15.75 10.83 1450.00 4157.68 1663.73 | -12.81 | 248.75 | 19.95 0.83 | 0.62 | 0.95 | 1.58 | |||||||
| 16-20 20.95 19.90 12.65 2000.00 5775.17 2310.69 | -13.42 | 246.31 | 22.26 0.85 | 0.68 | 0.95 | 1.43 | ||||||||
| 20-25 21.50 21.00 15.03 5200.00 13229.38 5291.50 | 13.38 | 353.54 | 29.34 0.89 | 0.72 | 1.02 | 1.39 | ||||||||