1. Introduction
hermal and non-thermal techniques are most common and popular method for municipal solid waste (MSW) treatment to produce energy. These technologies are widely used to reduce the environmental impacts caused by inadequate waste management [1]. Incineration and all other high temperature treatments are classified as waste thermal treatment. The basic idea of thermal process is to use heat resulting from burning waste to generate energy, while the non-thermal process is to generate energy without direct burning of waste or any burning resource [2].
As a result of continues improvement of thermal technologies, there are about 600 plants using incineration processes has been established recently to produce energy [3].
Incineration is considered as one of the common thermal methods, that is widely used as a treatment technique for MSW. One of main advantages of incineration is to reduce the quantity and volume of the waste. In incineration treatment process unprepared row materials are usually used [4]. Organics from the waste are collected and burnt at high temperatures. The incineration technique is an active technique that directly control of burning mixed waste in the presence of air at temperature range of 600-850Cº [1,6].
In addition to incineration, there are two waste thermal techniques which known as advanced thermal treatment (ATT) used in waste industry as gasification, pyrolysis. Pyrolysis can be classified as a process without the use of oxygen. It requires external heat to maintain the desirable temperature, while gasification is considered to be between pyrolysis and combustion with control of oxygen. [5] Compare to the other two thermal methods, incineration requires less area and less waste volume and quantity which can be considered to be more appropriate for Libyan waste management than the others.
Even though several ways are widely used to treat waste in the World, Libyan waste management has not applied any of the basic techniques at any waste treatment level. In this paper, Pfaffenauincineration treatments model has been studied to apply it in El-Marj city. The results show that the rate of waste in the city (kg/capita/ day) has been increased from 0.68 in 2006 to 1.08 in 2015. In addition, based on the thermodynamic equation our calculations show that one MW can be generated from one ton MSW. This paper is divided as following, types of thermal of waste treatment, data collections, model, results and conclusions.
2. II.
3. Methods of Thermal Waste Treatment
The major difference between the three thermal technologies incineration, pyrolysis and gasification is shown in table 1. Temperature, pressure, atmosphere, stoichiometric ratio and products from the process are used as the base of comparisons between the three methods [6]. Based on the prvious researches and our calculations the rate of 0.68-1.08 is used in this study. The technical data for MSWI potential for EL-Marj is shown in table2.
The average of waste can be calculated as following equation.
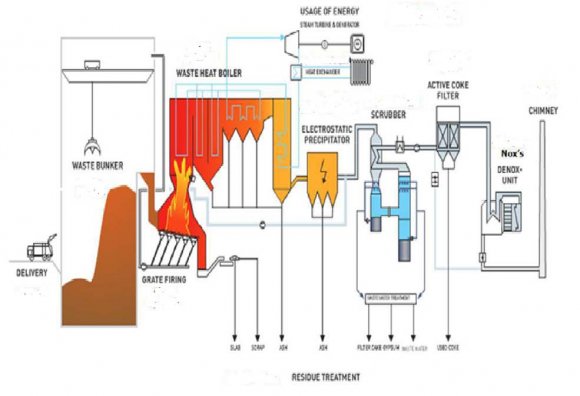
??????????????????????????????????? ???? ???????????? ? = ???????????????????????????????????????????????????????????? ??????????????????????????????????????????In this research, the average number of a family is assumed to be 7. This model was constructed in 2000 and it operated since 2001. In the first stage of waste incineration process, the MSW are delivered to waste banker then, moves to the pre-combustion process where metal and glasses are removed. Gas and slug or ashes are produced during the combustion stage. Flue gas is cleaned by using different filters. The clean gas is emitted through chimney in the last stage of the process. Thermal conversation of waste to energy is now very much applied technology for waste management system due to the generation of heat and energy from the waste stream. [6,8] V.
4. Mathematical Model and Data Analysis
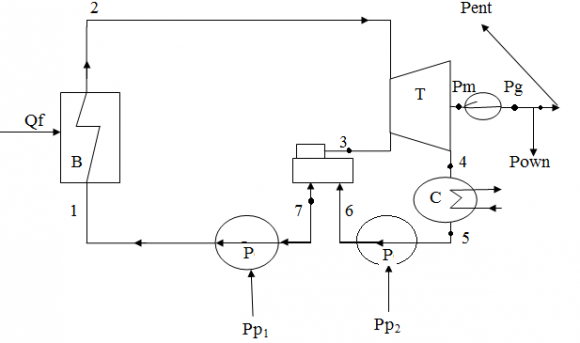
The mathematical model is the model that describes the accounts of the system when changing conditions of operation based on form physical in the, model is as follows: The Fig. 2 shows Diagram of the most essential component of the station.
The calculation of the generated potential energy from MSW incineration is obtained from thermodynamic equations mentioned below and fixed thermodynamic conditions in table 4 [11].
5. B=Boiler , T= turbine , C= Condenser ,P= pump
The amount of heat supplied by fuel (Q f )
?? ?? = ?????????????????????? ( ????/?? ) ,?? ?? = ???????????????????????????????????????????? (????/????) ?? ?? = ?? 2 × ( ? 2 ? ? 1 )(5)The amount of steam supplied by boiler ( Qs )
?? ?? = ?????????????????????? ( ????/?? ) ? 2 = ??????????????????????????????????????? 2 ,? 2 = ?? ( ?? 2 , ?? 2 ) ? 1 = ??????????????????????????????????????? 1 ?? = ( ?? ?? ? ?? ?? / ?? ?? ) (6)Overall Efficiency of The Plant (??) needs of electricity of power pump ( ?? ?? )
? ??? = ?? ?????? ?? ?? × 100(7)? ???? Thermal efficiency ( % )
??. ??. ?? = ?3600 × ?? ?? ? ???????? ?? ?????? (8) ??. ??. ?? = 3600 ×?? ?? ?? ??????(9)S.f.C specific fuel consumption (kg f / kW h )
6. S.S.C specific steam consumption (kg s / kW h )
By conducting the calculations on the station and at temperatures ranging from 400 to 600 the change in output power ranging from 20 to 40 MW. Our calculations based on the upper equations show that the best efficiency can the plant reached is 28% at a temperature of 600 C º with lowest rate of fuel consumption. These results are show in table 5, table 6, table 7.
7. Results and Analysis
Based on the fixed values taken from the table 4 the electrical energy produced from 20-40 MW were calculated during the changes of temperature degrees from 400 to 600 Cº. From equation (1) the mechanical energy was calculated (P m ) and by using equation (2) we calculated (p g ) gross energy and from it we got the total efficiency energy (p net ). From the thermal capacity of waste (CV) which amounts from 5000-30000 kJ/kg, where we had assumed it to be (30000), the thermal energy of waste (Q f ) was calculated from equation (4) and with using table steam on the temperature degrees from 400-600Cº the Enthalpy steam (h 1 -h 2 ) was found and from it the thermal energy of steam (Qs) was calculated. Through the previous equations, the thermal efficiency was calculated (? th ) with the reparation in equation ( 7) and the total efficiency (?o) from equation (6). Also the rate of consumption of fuel and gas (S.f.c), (S.S.c) from equation (8,9) and through it we obtain the results that are provided in the tables (5) (6) ( 7) that show each study on its own included with the change of temperature degrees from 400,500,600Cº respectively.
After holding these accounts on bikes mentioned the heat was taking the temperature of 800Cº and 1200 Cº and found that there is an increase in the overall efficiency of the plant with a lack of consumer waste mass.
8. VII.
9. Conclusions
In this paper we have calculated the daily amount of solid waste for each person, so it can be used to generate the thermal or electrical energy by burning it in the bed furnace and thus gaining heat with temperature above 850c º . We have applied thermodynamic equations to calculate the daily amount of solid waste for each person, so it can be used to generate the thermal or electrical energy by burning it in the bed furnace and thus gaining heat with temperature above 850c º . We have applied thermodynamic equations to calculate the rate of produced energy from 20Mw to 40Mw with change in temperature from 400c º to 600c º and to achieve results for the rate of fuel consumption, total efficiency and thermal efficiency. From these results it has been shown that the most efficient and least consumed fuel is at temperature of 600c

| Pyrolysis | Gasification | Combustion | ||
| Temperature (ºC) | 250 -700 | 500 -1600 | 800 -1450 | |
| Pressure (bar) | 1 | 1 -145 | 1 | |
| Atmosphere | Inert/nitrogen | Gasification agent: | Air | |
| O2, H20 | ||||
| Stoichiometric ratio | 0 | <1 | >1 | |
| Products from the | ||||
| Process | ||||
| Gas phase: | H2, CO, | H2,CH4, CO, CO2, | CO2, H2O, O2, N2 | |
| hydrocarbons, | H2O, N2 | |||
| H2O,N2 | ||||
| Ash, slag | ||||
| Solid phase: | Ash, coke | Slag, ash | ||
| Liquid phase: | Pyrolysis oil and water | |||
| III. | El-Marj Mswi Municipal Solid | |||
| Waste Input Data | ||||
| Year | Citizens | Waste indicators [kg/capita/ day] | Waste quantity [Kg/year] | Waste quantity [ton/year] | The cumulative amount of waste |
| 2006 | 55340 | 0.68 | 37.7 | 13505 | 13505 |
| 2007 | 62234 | 0.98 | 60.6 | 22228.5 | 35733.5 |
| 2008 | 71674 | 0.99 | 70.95 | 25896.75 | 61630.25 |
| 2009 | 80467 | 1.00 | 80.46 | 29367.9 | 90998.15 |
| 2010 | 89654 | 1.015 | 90.10 | 32886.5 | 123884.65 |
| 2011 | 98675 | 1.028 | 101.43 | 37021.9 | 160906.5 |
| 2012 | 107765 | 1.041 | 112.18 | 40945.7 | 201852.2 |
| 2013 | 116897 | 1.054 | 123.2 | 44969 | 246821.2 |
| 2014 | 125987 | 1.067 | 134.43 | 49067 | 295888.2 |
| 2015 | 135119 | 1.08 | 145.93 | 53264 | 349152.2 |
| P net , MW | M f , kg/s | ? ???? | ??% | s.f.c, kg f /kwh | S.S.C Kg s /kwh | Mcw |
| 20 | 3.2 | 27 | 20 | 0.58 | 5.4 | 1878 |
| 25 | 4.05 | 27 | 20 | 0.58 | 5.3 | 2347 |
| 30 | 4.8 | 27 | 20 | 0.58 | 5.3 | 2738 |
| 35 | 5.5 | 27 | 20 | 0.58 | 5.3 | 3207 |
| 40 | 6.2 | 27 | 20 | 0.58 | 5.3 | 3598 |
| , MW | M f , kg/s | th | ,% | s.f.c, kg f / kwh | S.S.C kg s / kwh | Mcw |
| 20 | 2.3 | 38 | 28 | 0.4 | 3.1 | 1118 |
| 25 | 2.8 | 38 | 28 | 0.4 | 3.1 | 1344 |
| 30 | 3.4 | 38 | 28 | 0.4 | 3.1 | 1666 |
| 35 | 4.1 | 38 | 28 | 0.4 | 3.1 | 1988 |
| 40 | 4.8 | 38 | 28 | 0.4 | 3.1 | 2214 |
| VI. |