Rework Reduction of Gaps and Alignments in an Automobile Assembly Plant

Table of contents

1. Introduction

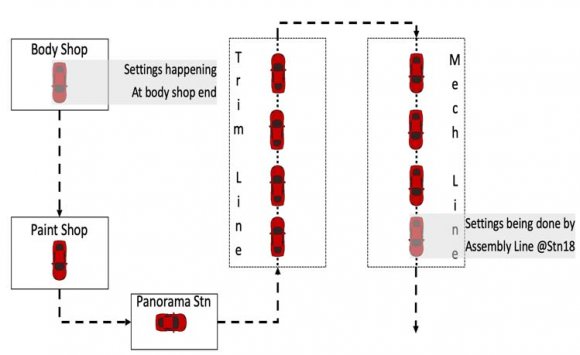
he XYZ assembly plant consisted of four major production units namely Body shop, Paint shop, Assembly line and Finish line. Body shop, Assembly line and Finish line each has a quality-check workstation at the end of their respective lines. Nonconformity of gaps and alignments, of a certain car model assembled in the plant was observed frequently. This nonconformity to standards resulted in excess rework after the quality-check of Assembly line. The workstation where these gaps and alignments were set acted as a bottleneck for the entire assembly line (because operators of this workstation were required for heavy rework frequently) which in turn affected the productivity of the entire plant. Process standardization was required along with verification of Body shop and Assembly line standards for gaps and alignments. The cause of excess variation in dimensions wastobe identified.

2. II.

3. Preliminary Analysis a) Root Cause Analysis

Defined problem was rejection of cars due to measure of gaps and alignments present not conforming with the allowed specifications. Checkpoints between 'door and fender' of the car were identified to be in the crash zone and 100% cars were affected by this problem. Location of the problem was identified to be the workstation of Assembly line where gaps and alignments were set. For future reference, the workstation will be named -Station 18.

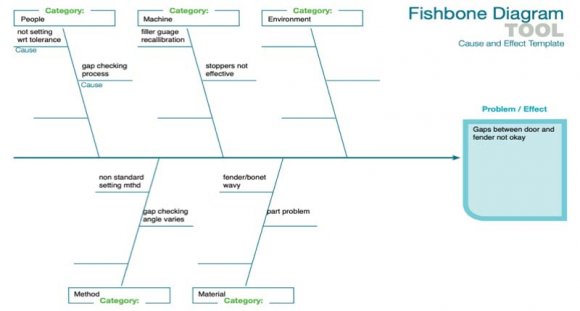
4. b) Cause Effect Diagram

The cause effect diagram revealed that the operator checking process for gaps and alignment was improper and could be a potential cause of excess variation. Another plausible cause identified was irregular recalibration of filler gauges rendering them to show incorrect values of gaps.

5. Methodology

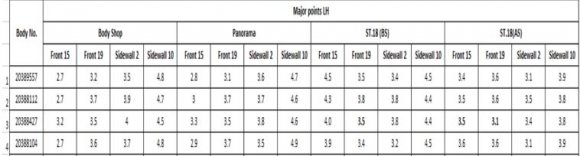
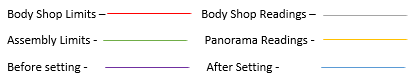
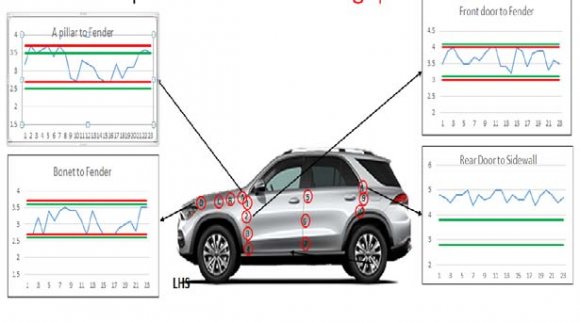
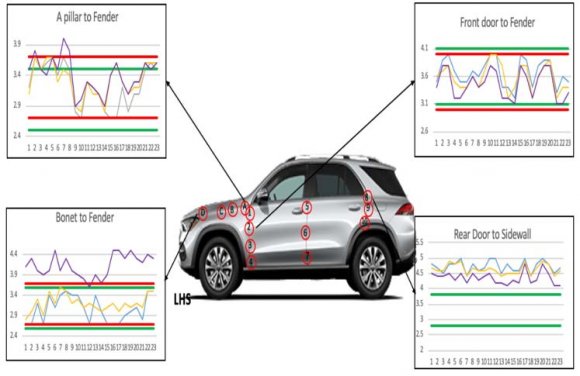
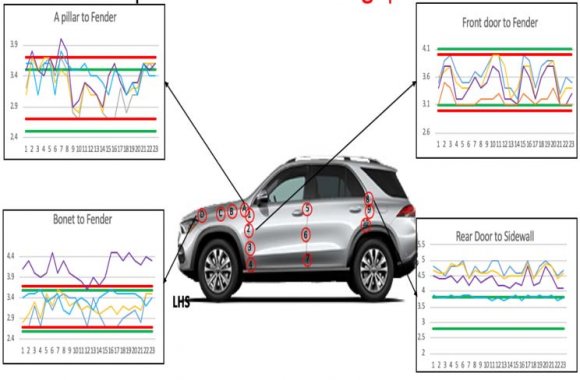
Four major tasks were implemented to tackle this issue. These tasks included identification of missing checkpoints in Body shop, collecting data for four important checkpoints at four different stages and plotting graphs. IV. On performing root cause analysis and analyzing the trends of different measurements of gaps and alignment, recommendations of gap setting at Body shop are provided. Apart from that, standardization of the process, placing skilled operators for setting gaps and revising the standards was recommended.

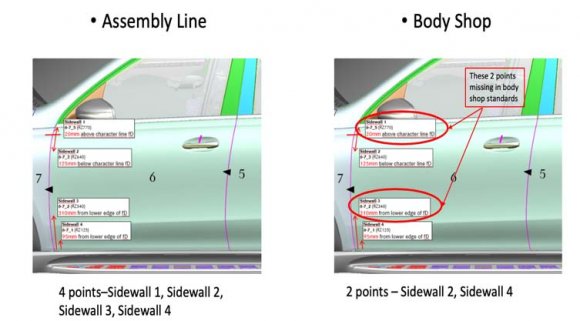
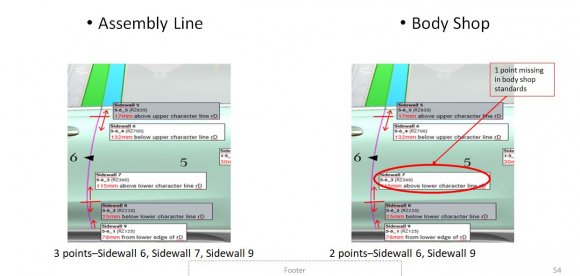
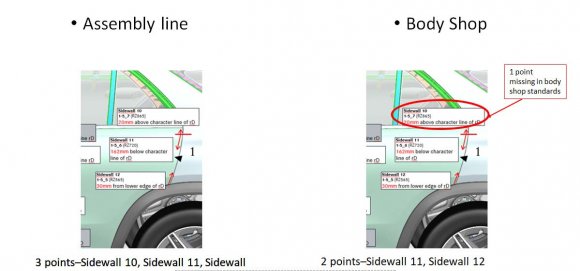
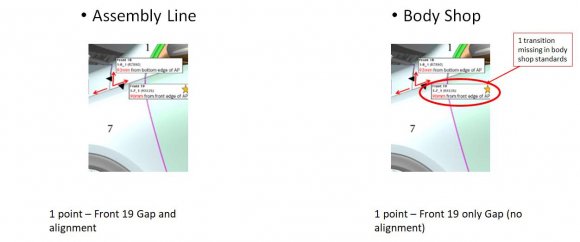
6. a) Identifying missing checkpoints for gaps and alignments

7. Results and Conclusion

Similar methodology can be implemented for other crucial gaps and alignments. Bonnet and front bumper gaps can be considered as cycle time is increased drastically if the process is not efficient and standardized. Further an electric measurement system could be used to minimize time required to take readings.

Figure 1. Figure 1 :
1Figure 1: Cause Effect DiagramAuthor ? ?: Industrial and Production Department, Vishwakarma Institute of Technology, Pune, India. e-mails: anand.umrani@vit.edu, harshvardhan.uttarwar16@vit.edu
Figure 2. Figure 2 :
2Figure 2: Door to Fender CheckpointsThe two checkpoints between door and fender of the car, highlighted in the figure are not checked at the Body shop quality-check workstation. Since Body shop operators do not put any kind of effort to bring these points in specified tolerance limits, it takes much more time for Assembly line operators to adjust the gaps at these checkpoints.
Figure 3. Figure 3 :
3Figure 3: Door to door checkpointsThe checkpoint highlighted here, between 2 doors of the car is missing in list of specified Body shop checkpoints.
Figure 4. Figure 4 :
4Figure 4: Rear Door to Sidewall checkpoints The 'rear door to sidewall' of the car had three checkpoints at Assembly line quality-check workstation whereas Body shop quality-check workstation had two checkpoints.
Figure 5. Figure 5 :?
5Figure 5: A-pillar to Fender checkpointSimilarly, the highlighted checkpoint in fig.5was measured for gaps at the Body shop but the alignment was not measured whereas tolerance limits for alignment were specified at Assembly line.b) Data Collection? The data collection sheet was designed to accumulate data on a single sheet and 4 gapcheckpoints were decided to be monitored which affect every car and required urgent attention. ? These gap-checkpoints were present between 'fender and door', 'fender and bonnet', 'fender and A pillar' and 'rear door and sidewall'. 'Door to door' gaps were not monitored as cycle time was not increased drastically due to these gaps. ? These 4 checkpoints were measured at Body shop quality-check workstation to see if gaps were within tolerance.?Then they were measured at Panorama workstation (first workstation of Assembly line) to observe the development of gaps when car comes from paint shop. ? Later, checkpoints were measured at workstation 18 of Assembly line before setting the gaps and alignment to see the variation caused by assembly process. ? After setting, data points at workstation 18 weremeasured to observe how setting these gaps affect other gaps. ? The data-sheet tracked gaps by assigned body numbers to different cars and a sample of the sheet is shown in fig. 6.
Figure 6. Figure 6 :
6Figure 6: Sample Data Collection Sheet c) Plotting GraphsThe data points at each stage for all four points were plotted on a line graph. The tolerance limits of Body Shop as well as Assembly Line were included in the graph. A sample of graphs for one of the checkpoints (Front door to Fender) considered is shown below.
Figure 7. Figure 7 :
7Figure 7: Flow of car through the Plant
Figure 8. Figure 8 :Figure 9 :
89Figure 8: Legend
Figure 9. Figure 10 :
10Figure 10: At Panorama workstation and workstation 18 before setting on Assembly line
Figure 10. Figure 11 :
11Figure 11: After setting at workstation 18 on Assembly line Similarly, graphs for each checkpoint considered were determined at each of the four stages.This process was implemented for gaps and alignment on both the left-hand side of the sample cars as well as the right-hand side. Final inferences were derived by analyzing trends of different gaps.
Figure 11. Figure 12 :
12Figure 12: All four checkpoints at Body shop quality-check workstation
Figure 12. Table 1 :
1
Checkpoint Body Shop Standards Recommendation Remarks
A pillar to Fender 3.2+0.5 3.2-0.5 2.7-3.2mm Within Body Shop Standards
Bonnet to Fender 3.2+0.5 3.2-0.5 2.7-3.2mm Within Body Shop Standards
Door to Fender 3.5+0.5 3.5-0.5 3.1-3.6mm Within Body Shop Standards
Rear Door to Sidewall - 4.0-4.5mm Checkpoint to be added
1

Appendix A

Appendix A.1 Acknowledgment

I would like to thank the management of XYZ plant for providing me this special opportunity to undergo training in this esteemed organization.

I would like to thank my professor, Anand Umrani, for the patient guidance, encouragement and advice he has provided throughout my time as his student. I have been extremely lucky to have a supervisor who cared so much about my work, and who responded to my questions and queries so promptly.

Appendix B

  1. Root Cause Analysis: A Framework for Tool Selection. A Mark Doggett . Quality Management Journal 2005. 12 (4) p. .
  2. 200.4. A slotislicol comparison of three rool cause ono~sil tooIs. A M Doggett . 1lO. 2. Jovrnol of Indul/rial Technology 20.
  3. Root COlle onolYJii: Simplified /ooIi 000 rechniqllel, B Andersen , T " Ond , Fogerhoug . 2000. Milwoukee: ASQOl1olity Press.
  4. Root cause analysis: A tool for talal qualiry manogemenl, P F Wilson , L D Dell , G F Anderson . 1993. Milwoukee: ASQ Quality Press.
  5. A cccse-c ndellect oPPfOOCh to analyzing continuous improvement alan electronics manufacturing facility. T E Gattiker , L H Boyd . Prodvclion and Inventory Manogement Jovrno/ 40 no, 1999. p. .
Notes
1
© 2020 Global Journals
Date: 2020-01-15