1. Introduction
he discussions on the various options for methods to alleviate the high global postharvest losses that negatively impact on agro-produce value-chain are on-going (Gbaha et al., 2007;Mujumdar, 2007).Recent research work has focussed on using renewable energy technologies for drying of agro-produce as possible preservation methods to reduce postharvest losses (Gustafsson et al., 2013). Solar dryers have increasingly become popular especially on account of their favourable relative costs of investment and operation. However solar dryers have not yet being adopted in Botswana despite the country's endowment with abundant sunshine (Weiss and Buchinger, 2015). As part of an effort to intimately understand the challenges of the agro-producers and to establish the need for solar drying technology in the country, a survey was conducted. The study area for this survey was Gaborone and its environs. The survey targeted a cross section of stakeholders that included farmers, distributors, and retailers.
2. a) Research Questions
The main objective of this study was to assess the challenges being faced by stakeholders of agroproduce and to establish if there is need for solar dryer technology for preservation by drying. Hence, the survey was conducted to answer the following research questions:
1. Which are the agro-materials in need of preservation by drying in Botswana? 2. What are the challenges of preservation of agroproduce that are faced by agricultural communities of Botswana? 3. Is there a need for solar drying technology for agroproduce in Botswana?
3. b) Objectives
The specific objectives of this study were:
1. To establish the profile of agro-produce that are in need of preservation by drying in Botswana 2. To establish the challenges of preservation of agroproduce that are faced by agricultural communities of Botswana 3. To determine if there is need for solar dryer technology for agro-produce in Botswana.
4. II.
5. Methodology
The research methodology used in the realisation of these objectives comprised of secondary data collection, primary data collection and data processing. The responses to social-demographic questions in the questionnaire that included name, sex, age, and education were of relevance for qualitative analysis; but providing name of respondent was optional and was not included in this analysis. Analyses using SPSS descriptive statistics and binary regression were performed.
6. a) Secondary data collection
Secondary data was obtained from journals, annual reports and general literature particularly from Botswana Ministry of Agriculture and Food Security. The data was used to profile the agro-produce in the country and additionally gave indication on the commercial trend of the agricultural enterprises.
7. b) Primary data collection
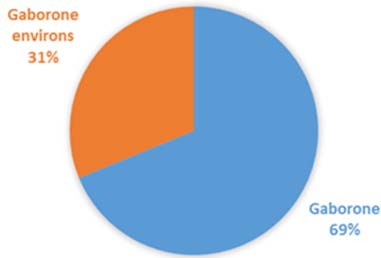
Primary data was obtained through a survey conducted in Botswana in June 2016 amongst targeted stakeholders. A questionnaire was administered, as the major tool for primary data collection distributed to various respondents who were contacted on voluntary basis. A variety of questions in the questionnaire were designed to collect data that would be analysed for the assessment of the need for solar dryer technology in Botswana as the intended purpose of the research study. The survey was conducted in Gaborone city and its environs including Mochudi and Mogoditshane.
8. c) Sampling methods
Four possible sampling methods for conducting the needs assessment survey were identified as: Random, Stratified, Systematic and Opportunity (Gamli, 2014;Sadeghi et al., 2013). The choice of a sampling method is based on the survey objectives and good representation of the target population. The execution time and accessibility of participants are the other important considerations. The Random, Stratified and Systematic Sampling methods apply probability-based sampling techniques whereas the Opportunity sampling method applies a non-probability-based sampling technique. The choice of the most appropriate sampling method for the study was made after analysing the opportunity cost of each of the four methods.
The Random Sampling method eliminates sampling bias, represents a target population but requires a great amount of time, effort and money. The chance of using the Random method in Gaborone was analysed. The target population in this survey was the consumer of the proposed solar drying technology in Botswana. The sample size corresponding to the population of Gaborone of 232,000 indigenous people by the 2013 national population census can be estimated. For a confidence level of =1.96 from the nominal tables corresponding to 95% confidence interval, error margin of 5% and proportion ratio , of 0.5, assumed half of target population. The sample size determined would require using at least 385 respondents by the formula (Cochran, 2007):
( ) 2 2 1 n Z p p e = ?(1)This would have required distribution of at least 1,153 questionnaires to potential respondents if the proportion of actual filled questionnaires was to be at least 30% of the total number of questionnaires distributed to the sample population. This is because of the high attrition rate (70%) that is associated with this type of survey (Barlett et al., 2001). To accomplish this exercise would have needed more research time and financial resources for implementation. Hence, the Random Sampling method was considered unsuitable for this research.
9. In
Stratified Sampling, the weighted participation of the target population makes it highly representative, but costly in time, effort and money. The number of strata in respect of the objective of the questionnaire would be very large and difficult to organise so as to get a representative sample population of Gaborone and its environs. In view of the time required to perform stratification of the sampling frame, the Stratified Sampling method was not considered for use in this research.
The Systematic Sampling method uses defined participants with similar experiences and at same conditions and is representative of the target population. The method pre-supposes well-defined and identifiable participants of the sampling population, which is not practically possible. In view of the difficult task of establishing the sampling framework and the high expenses incurred in implementation of the task, the Systematic Sampling method could not be applied in this survey.
The Opportunity Sampling method, uses people from a target population, available at the time and willing to participate. It is based on convenience; it is quick and easy, but may be biased as the target population may not be very representative. This is the sampling method that was chosen for this study. To secure a representative population, the target population was identified and it was composed of all categories of agroproduce value-chain stakeholders, namely, agrofarmers, major distributors of agricultural products, wholesalers, and retail supermarkets and vendors. These were essentially independent participants who accepted to participate in the survey on voluntary basis.
10. d) Survey questionnaire
A questionnaire constituting 16 named/defined variables formulated as 16 questions was developed as given in Table 1. These variables comprised of the participant's name, gender, age, education level, location, actor, produce handled, challenges faced, oversupply, preservation methods, drying problems, methods for improving preservation, need for solar drying technology, and suggestions by respondent for preservation of agro-produce. The questions that included name, sex, age, and education were of relevance for demographic analysis. Providing the name of the respondent was optional. The purpose for which each question in the questionnaire was meant to achieve has been provided.
11. e) Data Processing
First, the secondary data was analysed to give the profile of agro-produce in Botswana categorised as horticultural products and grains and pulses. The challenges faced by the stakeholders were analysed with respect to the postharvest losses experienced in each agricultural enterprise. Secondly, analysis of the primary data that was collected from the responses to the questionnaire was accomplished with the aid of Excel and Statistics Package for Social Scientists, IBM SPSS® Version 20.
The data filled in the questionnaires were coded. Each question or variable was categorised as nominal, ordinal or scaled. The nominal category takes the binary coding form of 0, 1. The ordinal variables were coded as 1, 2, 3, etc. The scaled variables were coded according to the levels of the judgment of their impact, by the scale of 1-5 (with 1 being the lowest and 5 highest). The demographic and explanatory variables used in the questionnaire are shown in Table 2. SPSS models were applied in the analysis: Descriptive statistics was applied for evaluation of frequency/percentages of variable occurrences. This was to give the statistics of the variable responses. Descriptive statistics and cross-tabulation were applied for teasing out demographic participants. Some variables were considered as predictor variables because of their relevance to precise prediction of solar drying as a method of preservation to be used in Botswana. The predictor variables were:
1. Preservation methods, PreservationM, that asked if the respondent wants to improve upon the preservation methods being used, 2. The drying methods, DryingM, that asked if the respondent wants to improve the drying method they are already using 3. The drying problems, DryingP, that asked if there were challenges or disadvantages associated with the respondent's method of drying the products 4. The solar technology SolarT, that asked if the respondent thought that solar drying technology is needed for preservation of agricultural products in Botswana.
Descriptive statistics and cross-tabulations of these variables was done with the socio-demographic variables that comprised of 1. Gender that asked if the participant was female or male 2. Age asked for the number of years the participant has lived 3. Education asked for level of education attained by the participant, 4. Actor, asks for the agri-business role played by each respondent in the sample population in the agro-produce value-chain.
Binary logistic regression was applied in the prediction of likelihood of adaptation of solar drying technology in Botswana. Logic codes 0, 1, are used in the coding of nominal variables, Y i expressed in binary format given as 1=agree and 0=disagree. The linear regression model for the odds probability expressed as, i P(Y )
i i i y x ? ? = = =is not sustainable because of overflow of values on the right hand side of the equation comprising of covariant and regression coefficient ? that exceed the boundary conditions of the probability domain (of 0-1). Hence the creation and transformation of the odds ratio i ? to a linear model by taking its natural logarithm, thus resulting into Logit model which opens the boundary restrictions to limits of -? to= +?.
The odds ratio ? is expressed as
1 i i i p p ? = ?(2)Where i p is the instantaneous probability of the covariant.
The Logit model is expressed as
( ) logit log log 1 i i i i p p ? ? ? ? = = = ? ? ? ? ?(3)Thus the generic multivariate logistic binomial distribution model is given as .
.
i 0 i i n n = +.. x .. + x ? ? ? ? (4)Where n is the number of occurrences, i
x are the independent variables, and i ? are the binomial coefficients.
The probability is evaluated by i exp( ) p 1 exp( )
i i ? ? = + (5)Logit model is the binary model used to predict likelihoods of occurrences by applying a stochastic approach. The SPSS Regression and Binary Logistic model was applied in this analysis to predict the likelihood of adaptation of solar drying technology, Solar T, for preservation of agricultural products in Botswana using five variables that were considered to have great influence over such outcome. The identified variables were Gender, Actor, Oversupply, Drying M, and Produce. These variables were identified as categorical; nominal, ordinal dependent variables and were coded accordingly. The dependent variable encoding is as given in Table 3.
III.
12. Results and Discussions a) Horticultural agro-products
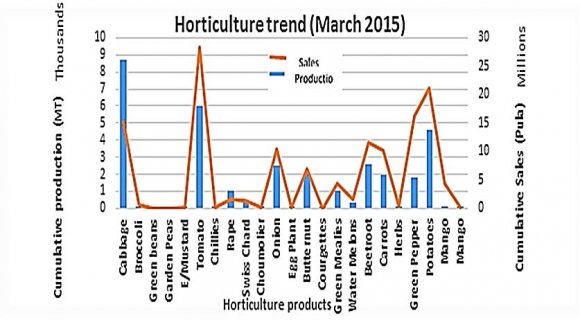
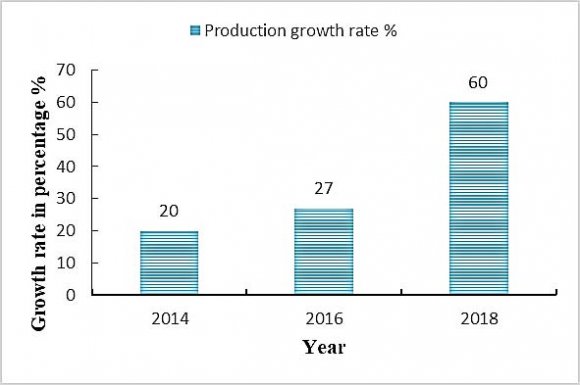
This study clearly shows that a large variety of horticultural produce is grown in Botswana. The produce includes cabbage, broccoli, green peas, garden peas, mustard, tomato, chillies, rape, Swiss-chard, choumoliver, onion, egg-plant, butter nut, courgettes, green mealies, water melons, beetroot, carrots, herbs, green pepper, potatoes, and mango (MoA, 2012). However, some horticultural produce is imported from neighbouring countries, particularly South Africa, to bridge the local supply gaps. The cumulative production and cumulative sales for the produce commodities in the month of March 2015 is presented in Figure 1 which shows the cumulative production in metric tonnes versus cumulative sales in Pula. The trend of commodity transactions on horticultural produce in Botswana for March 2015 indicated that products of highest commercial significance were tomatoes, potatoes, cabbage, beetroot and onions. The production growth rate is depicted in Figure 2. It shows that the growth rate of production of horticulture increased from 20% in 2014 to 60% in 2018. This is a positive trend for the country.
13. Global Journal of Researches in Engineering (A ) Volume Xx X Issue II Version I b) Grains and pulses
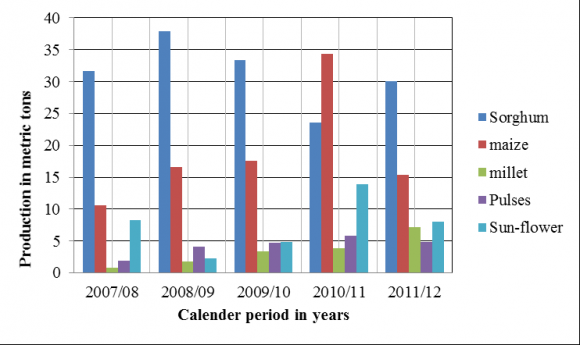
Figure 3 depicts the result of performance of grains and pulses analysed from the data obtained during the period 2007-2012. Botswana's crops of commercial and economic significance in the category of grains and pulses were sorghum, maize, pulses and sunflower. These are staple food crops for most households in Africa. Botswana is a net food importing developing country (NFIDC). Sorghum and maize are the main cereals, the basic foodstuffs with their national demand standing at 200,000 metric tons per year, of which only 17% is supplied through local production (BITC, 2019). The demand gap of 83% was met by importation from other countries.
14. c) Challenges faced by agro-produce value-chain actors
The challenges faced by the agricultural communities of Botswana are categorized as: i) postharvest losses on agro-produce and ii) preservation of the agro materials after harvest.
15. i. Postharvest losses of agro-produce
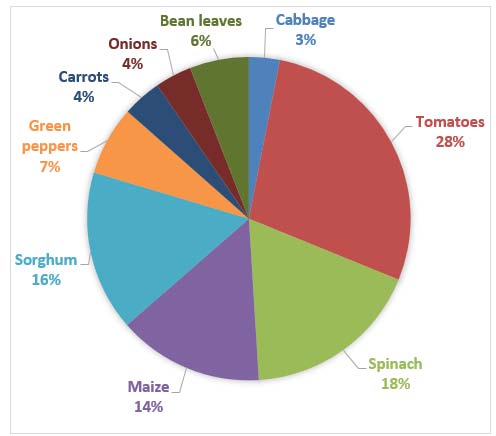
The ranking of average losses of agro-produce in Botswana in 2015 is depicted in the pie chart of Figure 4. Tomatoes posted the highest loss of 28%, followed by spinach at 18%, sorghum at 16% and maize at 14%. It is clear from the pie chart that the main grains (sorghum and maize) constitute 30% and the horticultural produce constituted 70% of the postharvest losses of agro-produce in Botswana. The spoilage percentages obtained from the respondents indicated varying losses for the different commodities with some agro-produce incurring more losses than others. The horticultural products were found to be generally the more perishable commodities. Tomato and spinach were overall the highest ranked in postharvest losses of agro-produce in Botswana.
16. Global Journal of Researches in Engineering (A ) Volume Xx X Issue II Version
ii. The challenges of preservation of agro-produce after harvest Table 6 gives the summary of challenges faced by the farming community of Botswana with regard to agro-produce handled and preservation methods used. The level of each challenge was rated as either low or both high. One of the major challenges encountered was that of quality deterioration issues and oversupply during the harvest season and low supply otherwise, resulting in loss of the produce, and by extension, income. Preservation challenges included inaccessibility of conventional technologies in rural locations and the high cost of the technologies. The open sun method, while cheap, has a major challenge of difficulties in assuring the quality of the products, due to a variety of factors such as long drying times, contamination due to exposure to the environment, encroachment by pests and vermin, as well as uncontrolled drying rates. These challenges indicated the need for alternative methods using affordable technologies such as solar based technologies, to improve on the existing methods.
17. d) Need for solar dryer technology in Botswana
The analysis of the data to establish the need for solar drying technology in Botswana was performed with the help of the SPSS Statistics package (Version 20, developed by IBM Corporation, Corporate headquarters, 1 New Orchard Road, Armonk, New York 10504-1722 USA). The results were categorized as Demographic statistics, Cross Tabulation statistics and Likelihood estimates.
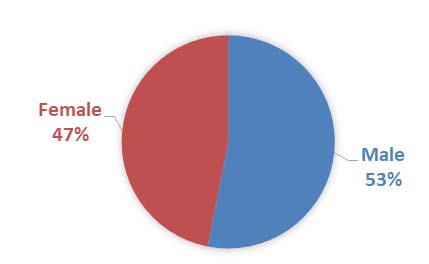
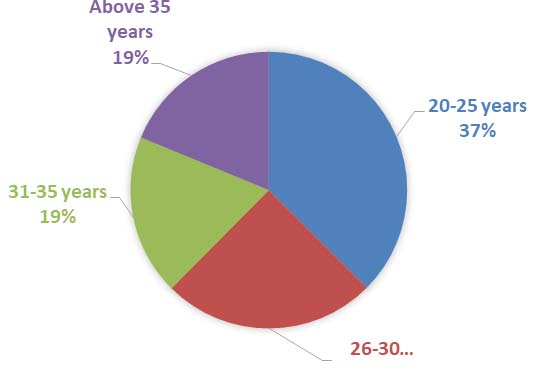
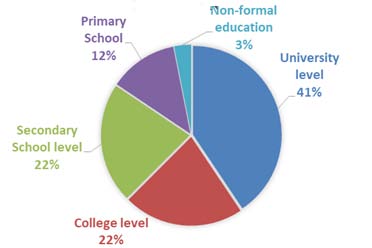
18. i. Demographic statistics
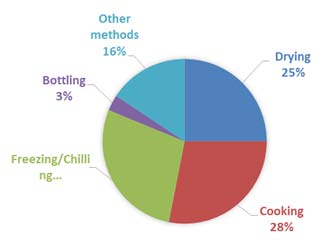
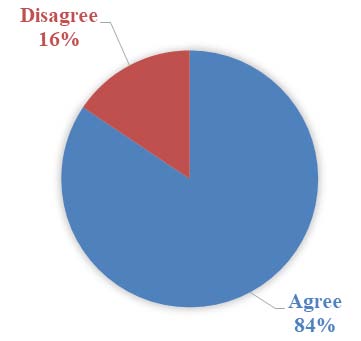
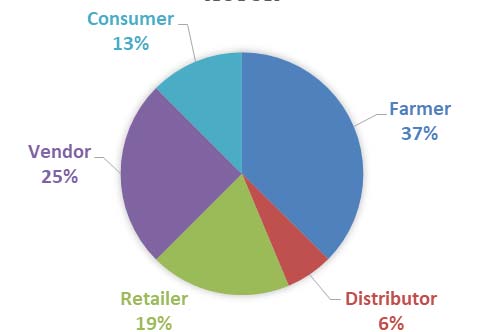
Figure 5 shows the responses according to gender. The total number of responses was 32 and comprised of 17 males and 15 females. Demographic statistics showed that there was fairly good gender balance with 46.9% female and 53.1% male. Figure 6: The pie chart according to age groups Figure 7 shows the education level of the respondents. All of the respondents were literate and understood the English language that was used in the questionnaire. By education, 40.6% of the respondents were of university level, 21.9% college level, 21.9% Secondary school level, 12.5% primary school level and 3.1% non-formal education. The highest number of respondents was of University level education. 9 gives the responses to the questions about the preservation methods presently used for preservation of agricultural products in Botswana. Various methods of preservation of agricultural products are used by respondents of whom 25% were drying agricultural products, 28.1% cooking, 28.1% freezing, 3.1% bottling and 15.6% used other preservation methods. The method of refrigeration/chilling was highest and was followed by drying and cooking. An overwhelming majority (84.4%) of the respondents agreed that the use of solar technology, SolarT, could be the better method for preserving their produce while 15.6% did not agree as depicted in Figure 10. The result indicates the responses of Actor variable are: 37.4% for Farmer, 6.3%, for Distributor, 18.8% for Retailer, 25% for Vendor, and 12.5% for Consumer. The farmer had the highest respondents, signifying the most agreeing stakeholder in the survey as depicted in Figure 11. The results of the cross-tabulation model analysis show that out of the total 32 respondents, 8 responded to the question on typical methods of preservation; 11 responded to the question on the drying methods used; 12 responded to the question regarding problems encountered with the drying method used; and 27 responded to the question on the need for solar drying technology.
The results of the cross-tabulations of Gender are presented in Table 7. The results indicate that of the 8 respondents for the variable PreservationM, 5 were females and 3 were males. For the variable DryingM, 7 out of the 11 respondents were males; and for DryingP, 5 of the 12 respondents were females and 7 were males. Further, the cross-tabulation of the SolarT variable with Gender indicted that of the 27 respondents, 12 were females and 15 were males. The cross tabulation results for Actor are given in Table 10. As shown, of the 14 respondents of Preservation M, 6 of the respondents were retailers, followed by farmers at 5 respondents; and the distributer, vendor and consumer at 1 respondent each. Of the 12 respondents of Drying M, 4 were Farmer, Distributer, Retailer and Consumer were each at 2 respondents and Vendor received 1 respondent. Of the 12 respondents of the Drying P, Farmer was the highest with 6 out of the 12 respondents; followed by Distributer and Consumer with 2 respondents each. Finally, of the 27 respondents of Solar T, 11 were farmers, 6 were vendors, 4 were retailers/consumers while 2 respondents were distributers. Table 12 shows the results of the predictor variables evaluated using Equation 4, depicting respective binomial regression terms. These predictor variables include the constant term. The variables are characterised by the binomial regression coefficient ?, standard error (S.E), estimate of the regression coefficient divided by its standard error defined as Wald. The one degree of freedom, d f, for the standard normal distribution, the significance, p-values that are statistically significant except for the constant term which is below 0.05. The odds ratio probability (?)is expressed as Exp ?, for each variable. The confidence intervals (95% C.I), depicting lower and upper values for each variable are expressed in terms of the odds ratio values Exp ?.
The determination of the need for solar dryer technology in Botswana was satisfactorily accomplished. The assessment provided answers to the questions of agro-produce profile that need to be preserved by solar drying, the challenges encountered by the agricultural communities and the determination of whether there was need for a solar dryer technology in Botswana as follows:
The profile of agro-produce grown in Botswana covers a limited range of grains and pulses and a large variety of horticultural produce despite being a semi-arid country. There was a positive trend of production of horticultural produce in Botswana for March 2015 with tomatoes, potatoes, cabbage, beetroot and onions as the top commercial commodities. However, Botswana is a net food importing developing country. Sorghum and maize are the main cereal foodstuffs with their national annual demand of 200,000 metric tons, of which only 17% was supplied through local production while the supply demand of 83% was met by importation from other countries in 2019. The overall postharvest loss distributions were: i) the main grains (sorghum and maize) constituted 30%, and ii) horticultural produce constituted 70%. Tomato posted the highest loss ranking of 28%, followed by spinach at 18%, sorghum at 16% and maize at 14%. The loss ranking clearly showed that tomato was the most in need of preservation by drying.
The greatest challenge faced by actors in agroproduce value-chain is the postharvest loss. Moreover, Year 2020 A Research Study to Determine if Solar Dryer Technology for Preservation of Agro-produce is needed in Botswana IV.
19. Conclusion
conventional preservation methods are generally unaffordable by the poorer rural communities. These communities often use the inappropriate methods of preservation such as the open sun drying method which is not quality assured. And yet solar dryer technology is scarce in Botswana.
The study answered the question of whether there was need for solar dryer technology in Botswana. Demographic statistics indicated 84.4% acceptance of solar dryer technology in Botswana. Additionally, there was fair gender balance with the youthful age bracket (20-25 years), university level education, and the farmer among the actors; these were identified as the highest respondents in favour of solar drying technology; indicating the sustainability of the technology when adapted. The study has established that there is need for solar drying technology in Botswana and, by the Logit model, predicted that the likelihood of acceptance of the technology was 87.5%.
| Demographic variables | Explanatory variables | ||
| Variables | Category | Variables | Category |
| Gender | Nominal | Produce | Ordinal |
| Age | Ordinal | Challenges | Scale |
| Education | Ordinal | Oversupply | Nominal |
| Actor | Ordinal | PreservationM | Ordinal |
| Location | Nominal | DryingM | Ordinal |
| DryingP | Scale | ||
| Improvement | Scale | ||
| SolarT | Nominal | ||
| Suggestions | Ordinal | ||
| Original Value | Internal Value |
| Disagree | 0 |
| Agree | 1 |
| Predicted | |||
| Observed | Dependent dichotomous variable, Solar T | Percentage correct | |
| Disagree | Agree | ||
| Disagree | TN | FP | ON |
| Agree | FN | TP | OP |
| PN | PP | Tupp | |
| Case | Notation |
| TN | True negative |
| FN | False negative |
| FP | False positive |
| TP | True positive |
| PN | Predicted-Negative=TN+FN |
| PP | Predicted-Positive=FP+TP |
| ON | Observed-Negative=TN+FP |
| OP | Observed-Positive=FN+TP |
| Tot | Total cases= TP+FP+FN+TN |
| Tupp | Total true cases=TN+TP |
| Rating of | ||||
| Item | Challenges | challenge | Remarks | |
| Low | High | |||
| Oversupply | ? | ? | Loss of value | |
| Agro-produce | Quality deterioration | ? | ? | Non/Perishability |
| Storage facilities | ? | Lacking in rural settings | ||
| Transport | ? | Inappropriate | ||
| Conventional preservation methods | Quality of product Availability Cost | ? | ? ? | Limited shelf-life Inaccessible in rural settings High investment |
| Quality of product | ? | ? | Not quality assured | |
| The open sun | Availability | ? | Intermittent | |
| drying method | Cost | ? | ? | Free but affected by weather |
| Low awareness | ? | Not disseminated | ||
| Solar dryer | Non availability | ? | Nascent technology | |
| Cost of technology | ? | ? | Unknown | |
| Variables | Gender | |
| Female | Male | |
| PreservationM =8/32 | 5 | 3 |
| DryingM=11/32 | 4 | 7 |
| DryingP=12/32 | 5 | 7 |
| SolarT =27/32 | 12 | 15 |
| Table8 shows the cross-tabulation model | ||
| results of drying variables with Age. It was observed that | ||
| the age group 20-25 years was the highest represented | ||
| in all the four variables: 5 out of 8 for PreservationM; 4 | ||
| out of the 11 respondents for DryingM; 4 out of the 12 | ||
| respondents for Drying P; and 9 out of the 27 | ||
| respondents for SolarT. | ||
| Variables | Age | |||
| 20-25-25yrs | 21-30 | 31-35 | 35+ | |
| PreservationM =8/32 DryingM=11/32 | 5 4 | 1 3 | 1 2 | 1 2 |
| DryingP=12/32 | 4 | 4 | 1 | 3 |
| SolarT =27/32 | 9 | 6 | 6 | 6 |
| The cross-tabulation model results for | ||||
| Education with the drying variables are given in | ||||
| A Research Study to Determine if Solar Dryer Technology for Preservation of Agro-produce is needed in |
| Botswana |
| respondents of Solar T variable, University level was |
| highest with 12. |
| Year 2020 |
| 32 |
| I |
| (A ) Volume Xx X Issue II Version |
| of Researches in Engineering |
| Global Journal |
| © 2020 Global Journals |
| Education | |||||
| Variables | Unive rsity | Coll ege | Secon dary | Prima ry | Non-form al |
| PreservationM 8/32 | 4 | 2 | 1 | 0 | 1 |
| DryingM=11/3 2 | 5 | 3 | 2 | 0 | 1 |
| DryingP=12/3 2 | 6 | 4 | 1 | 0 | 1 |
| SolarT =27/32 | 12 | 5 | 6 | 3 | 1 |
| Variables | Actor | ||||
| Far | Distrib | Reta | Ven | Consu | |
| mer | uter | iler | dor | mer | |
| PreservationM =14/32 | 5 | 1 | 6 | 1 | 1 |
| DryingM=11/3 2 | 4 | 2 | 2 | 1 | 2 |
| DryingP=12/32 | 6 | 2 | 1 | 1 | 2 |
| SolarT =27/32 | 11 | 2 | 4 | 6 | 4 |
| iii. Likelihood estimates | |||||
| The results of the binomial regression using | |||||
| logic model are given in the Classification Table 11 | |||||
| whereby the overall percentage of likelihood is predicted | |||||
| as 87.5%. | |||||
| Predicted | ||||
| Observed | SolarT | Percentage | ||
| Disagree | Agree | correct | ||
| Disagree | 2 | 3 | 40 | |
| SolarT | Agree | 1 | 26 | 96 |
| Overall percentage | 87.5 | |||
| a=the cut off value of overall percentage is 50% | ||||
| Variable | ? | SE | Wald | d f | p-value | Exp ? | Exp ? with 95% C.I. Lower Upper | |||
| Gender | 0.229 | 1.306 | 0.031 | 1 | 0.861 | 1.257 | 0.097 | 16.269 | ||
| Actor | 0.564 | 0.613 | 0.847 | 1 | 0.357 | 1.757 | 0.529 | 5.837 | ||
| Produce | -0.805 | 0.488 | 2.72 | 1 | 0.099 | 0.447 | 0.172 | 1.164 | ||
| Oversupply -3.512 | 1.881 | 3.485 | 1 | 0.062 | 0.03 | 0.001 | 1.192 | |||
| DryingM | 1.06 | 1.403 | 0.57 | 1 | 0.45 | 2.885 | 0.184 | 45.138 | ||
| Constant | 5.199 | 2.544 | 4.175 | 1 | 0.041 | 181.059 | ||||
| From the Table 12, the odds ratio is >1 for | Equation 4, the Logit model for this study that fits the | |||||||||
| Drying M, Actor and Gender but <1 for Produce and | regression data for giving an estimated evaluation of the | |||||||||
| Oversupply variables. Therefore, Drying M, Actor and | probability of accepting solar dryer technology in | |||||||||
| Gender are key parameters in motivating the likelihood | Botswana is given as | |||||||||
| of acceptance of solar drying technology. Using | ||||||||||
| logit = log | ? ? ? | pi 1 -pi | ? ? ? | = 5.199 +1.06 * DryingM +0.564* Actor +0.229* Gender | ||||||
| -0.805* Produce -0.512* Oversupply | ||||||||||