1. Introduction
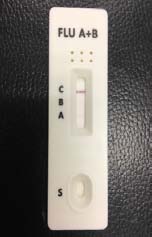
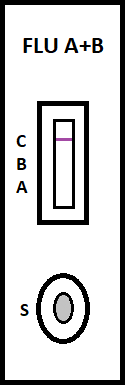
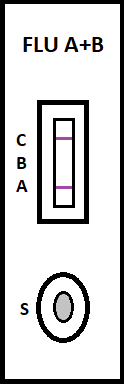
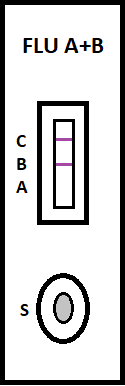
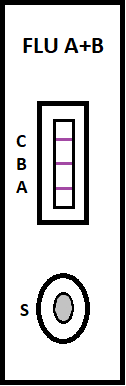
irus-caused influenza is one of the most severe viral respiratory infectious disease. Avian influenza of 2003 and the swine flu of 2009 have been among the cases in recent years. Once a highly contagious and lethal strain of influenza virus emerges, it often leads to a pandemic. Therefore, aside from the SARS of 2013 and COVID-19 of 2019-2020, which are also virus-caused, influenza has been the focus of international epidemic prevention and monitoring policy. Because influenza shares many symptoms with the common cold, it is often difficult for a clinician to correctly diagnose the disease in a timely fashion. The standard method for detecting influenza viruses is viral culture and molecular biology testing methods such as RT-PCR, both of which can identify subtypes. Still, both need special equipment and longer testing times. Viral culture takes at least 48 hours, RT-PCR takes 4-6 hours, so clinicians in small clinics, emergency rooms or outpatient settings cannot obtain results in a short period after the examination, resulting in incoherent diagnosis. Consequently, healthcare workers use a series of rapid influenza diagnostic tests (RIDTs) at the point of care. The principle is to detect the surface antigen of influenza virus with known antibodies, and then to interpret with the naked eye in the form of immune chromatographic as says. They are simple to execute and deliver results in less than 30 minutes. They have become an effective way to detect viruses outside the laboratory. Overall, RIDTs had a high specificity of 90-95% but only a modest sensitivity of 50-80%. Studies show the performance of RIDTs depends on the prevalence of influenza virus in the population [1,2]. A study points out RIDTs with a sensitivity of 62.3% compared to the RT-PCR method [3].In the study, RIDTs performed better in influenza A virus detection.64.6% sensitivity in influenza A compare to 52.2% in influenza B. During the 2009 H1N1 pandemic, RIDTs showed 10%-70% sensitivity compared to RT-PCR-based tests [4][5][6][7].Drexler et al. used the BinaxNOW rapid antigenbased testing, reported a sensitivity of 11.1% [8].In the early days of the pandemic, a large study from New York used the RIDTs BinaxNOW influenza A-B test (BinaxNOW), 3M Rapid Detection Flu A-B test (3MA+B) compared to R-Mix culture [9,10] with a sensitivity of 9.6% and 40% respectively. Poor sample quality and inexperience of medical staff may contribute to the low sensitivity. These researches indicate many factor scan affect the sensitivity of RIDTs. It is low in numerous cases, so this study proposes a system to improve detection sensitivity, minimize the human influence, increase efficiency and reduce the demand for screening work force. The test procedure requires the healthcare worker to make a diagnosis if a stripe, no matter how faint it is, appears at the designated position as long as the control line is also visible. In clinical practice, however, there may be cases too vague for the human to make a definite judgment. Figure 3 This study applies machine vision technology to develop an automatic interpretation system for RIDTs to assist healthcare workers in the conduct of influenza virus testing, improve the correctness and efficiency, save workforce, and reduce the risk of misjudgment. Other medical tests currently dependent on the naked eye can also implement similar techniques.
2. II.
3. Problem Statement
4. III.
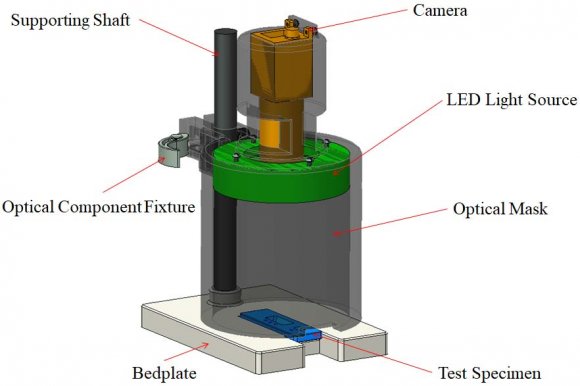
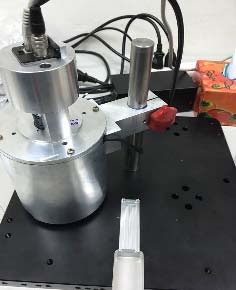
5. Hardware Setup
A typical optical inspection system includes a camera, a computer, a light source, and other necessary mechanical and electrical components.
6. Image Processing
The captured image, shown in Figure 6, is transmitted to the computer, which analyzes the stripes of the test specimen. The following subsections discuss the image processing techniques employed by the computer program. First, the test pad and the area showing the test lines are identified by image pre-processing. The specimen is overall much brighter than its background. The program separates them by a binary threshold, Figure 7(a). To find the region where the test lines may appear, the image is then processed by the Laplace-of-Gaussian (LoG) operator, Figure 7(b). The edges of possible features are found by the zero-crossing operation, Figure 7(c).The components are joined by the connection operation, Figure 7(d). The software finds the test region by selecting the one with the rectangularity between 0.9 and 1, and an area larger than 5000 pixels, Figure 7
7. Conclusion
This research studies the implantation of optical inspection in RIDTs and development of a working system. The experimental results show that it can provide useful assistance to the healthcare workers. With more clinical cases, its consistency and sensitivity can be examined. One may also extend the method to similar rapid tests in medical practices, e.g., COVID-19 diagnosis tests. A proper application of optical inspection techniques will reduce the medical staff's workload and possible human errors, in the meantime, increase test sensitivity and consistency.