1. Introduction
n highway design, bearing capacity of sub grade soil is of great importance in the determination of pavement thickness (Forkenbrock and Weisbrod, 2001). The sub-grade layer, which is the bottommost layer, is mostly affected as load comes upon it (Forkenbrock and Weisbrod, 2001). In Nigeria, California Bearing Capacity (CBR) test is one of the most common and comprehensive method currently used to determine the sub-grade strength. It is essentially a measure of the shear strength of a material at a known density and moisture content. The shear strength of soils can generally be considered in terms of Coulomb's Law, as discussed by Croney, (1977).Subgrade plays an important role in imparting structural stability to the pavement structure as it receives loads imposed upon it by road traffic (Croney, 1977;Forkenbrock and Weisbrod, 2001). A range of factors influence the CBR of a particular material. Carter and Bentley (1991) mentioned the soil type, density, moisture content and method of sample preparation as playing important roles. Apart from the material properties themselves, moisture conditions are also pivotal. The moisture conditions at which the material is to be used vary according to climatic region, and as such the soaked CBR test is used to simulate the worst likely conditions in service and the un-soaked simulate the normal field condition (Kumar, 2014). For determining soaked value of the CBR, the sample is submerged in water for 96 hours prior to performing the penetration test.
In the tropics, lateritic soils are used as a road making material and they form the sub-grade of most tropical roads (Alayaki, 2012). Lateritic soil is generally believed to be a very good sub-grade material for road construction. Nigerian roads and highways are usually constructed on compacted lateritic soils foundation. Although some lateritic soils (especially gravelly aggregates) have been found to be quite good in pavement construction particularly those with appropriate geotechnical characteristics, the limited availability of these materials in the country is a challenge to constructing durable roads and highways (Alayaki ,2012).
A good highway or road is a gateway to national development as they create access to infrastructure (Okovido and Musa, 2004). In Nigeria, the failure of engineering facilities such as roads and embankments has attracted numerous opinions on the causes (Orie and Nweni, 2015). These failures have necessitated the need for research which revealed that the causes of the highway failure were traceable to indiscriminate dumping of waste, the use of substandard materials and incompetent contractors. Apart from these mentioned causes, insufficient knowledge of the sub-grade of the intended site before use is also a contributing factor of failure (Orie and Nweni, 2015). Huge amounts of money are spent on road maintenance on annual basis, yet the pavement does not last for a long period of time before its fails as a result of not knowing the condition of the sub-grade before design (Alayaki, 2012). CBR test is one of those parameters that serves as an indication of sub-grade soil strength and hence the service-life of a pavement depends on the sub-grade (Sathawara and Patel, 2013). Comparing soaked and un-soaked CBR will help to know the behavior of the soil before and after construction. Knowing this will help to minimize the high rate of pavement failure, and money spent on yearly maintenance will be used for other projects that will boost the economic and social development of the country (Orie and Nweni, 2015;Alayaki, 2012).
The aim of this study is to develop a relationship between the index properties of lateritic soils and their soaked and unsoaked CBRs of lateritic soils. This relationship will help in quick assessment of CBRs of soils during the design stages of engineering projects.
2. II. Materials and Method
3. a) Study Area
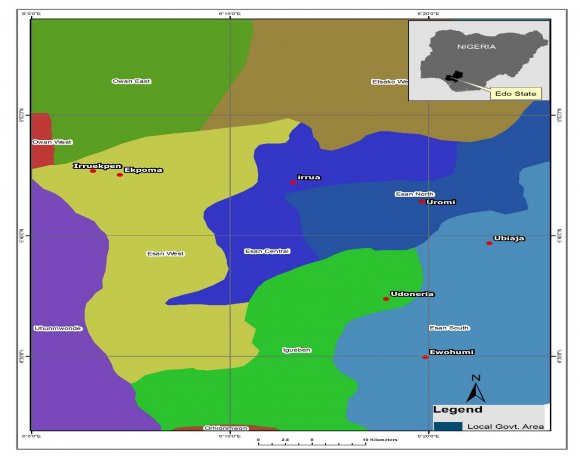
The study area covers Ebhohimi, and Ekpoma in Edo central senatorial zone of Edo state, Nigeria as shown in figure 1.
4. Figure 1: Location Map for the study area b) Sample Collection
In order to have sufficient and reliable data for the targeted analysis, soil samples were collected from the study area. The samples were collected along the road, and borrow pits. A total of Twenty (20) disturbed samples were collected, using hand auger at a depth of 1 m to 2 m. Some were taken from both side of the road within a reasonable sampling interval of 2 to 3 km. The sample locations are shown in Table 1.
5. d) Analysis of Data using Multivariate Regression
To find the dependence of the measured geotechnical parameters on the soaked and un-soaked CBR, mathematical modeling using multivariate regression analysis was done (Bello, 2012). CBR values were taken as dependent variables and index properties (LL, PL, PI, OMC, MDD (compaction tests values), % passing of 0.075mm and 0.425mm) as independent variables.
Multivariate regression equation of the form as shown in Equation 1 was used.
? ? ? ? ? + ? ? ? ? ? ? ? ? ? + + + = 5 5 2 2 1 1 0 ^x x x y (1)Where y is the dependent variables, 1. The first phase in the model development was the transformation of the independent variables (%passing 0.075mm and 0.425mm sieve, liquid limit, plastic limit, plastic index, maximum dry density (g/cm 3 ), optimum moisture content) into readable codes that can be used as input files for the analysis.
? ? ? ? ? , , , , ,2. The second phase was to define the dependent variables (Soaked and un-soaked CBR) and the model analysis method. In this case, least square regression based on multivariate model was selected. 3. The third and final phase was to compute the coefficient statistics, and assess the model strength using coefficient of determination, thereafter generate the multivariate equations.
III.
6. Results and Discussion
7. a) Laboratory Tests Results
The results of the laboratory tests for Ebhohimi borrow pits are shown in Table 2. Based on the obtained test results from Ebhohimi borrow pit (Table 2), the soil is classified as A-7-5 (sandy soil). From the conventional Atterberg limit tests, liquid limit values are in the range of 46.31 to 58.17, plasticity limit values are of 15.5 to 26.45 and plasticity index value of 26.12 to 41.06 as shown in Table 2. Soils with liquid limit less than 30% are considered to be of low plasticity, those with liquid limit between 30% and 50% exhibit medium plasticity and those with liquid limit greater than 50% exhibit high plasticity (Arora, 2004). All samples exhibited high plasticity except sample 4 in pits 1 and 2 which exhibited medium plasticity.
The particle size distribution passing through 0.075mm and 0.425mm ranged between 38.2 to 52.16 and 61.08 to 73.35, which indicate fine grained soils, the soil can be classified as sandy soil (Arora, 2004). The unsoaked CBR values ranged between 0.71 and 9.72, while its corresponding soaked samples range between 0.63 and 8.18%. The percentage decreases from soaked CBR to unsoaked CBR. This implies that as water is absorbed into the compacted specimen, the resistance to penetration becomes drastically reduced. It has been recommended by Federal Ministry of Works and Housing that the values of CBR for road base, sub base and subgrade should not be less than 80%, 30% and 10% respectively under soaked condition (FMWH, 1994). It can be seen that samples do not satisfy the condition for road subgrade, base and sub-base. Hence the CBR from that particular borrow pits are very low. The laboratory tests results for soils from Ekpoma are presented in Table 3. Based on the obtained test results of plasticity, the soil classification was made in accordance to the AASHTO classification system, and it was classified as A-7-5, A-2-6, A-6. From the conventional Atterberg limit tests, liquid limit value ranging from 27.76 to 53.32, plastic limit value of 13.43 to 25.20 and plasticity index value of 11.92 to 34.32. Soils with liquid limit less than 30% are considered to be of low plasticity, those with liquid limit between 30% and 50% exhibit medium plasticity and those with liquid limit greater than 50% exhibit medium plasticity and those with liquid limit greater than 50% exhibit high plasticity. The values of California bearing ratio have been shown in Table 1. It has unsoaked CBR ranges between 10.1 and 33.2, which that of its corresponding soaked samples range between 3.48 and 17.6%. The percentage decreases from soaked CBR to unsoaked CBR. This implies that as water is absorbed into the compacted specimen, the resistance to penetration becomes drastically reduced. It has been recommended by Federal Ministry of Works that the values of CBR for road base, subbase and subgrade should not be less than 80%, 30% and 10% respectively under soaked condition. It can be seen that some of the samples satisfy the condition for road subgrade, but for it to be used for base and subbase materials, it is advisable to improve the soil by stabilization or excavation of the soil.
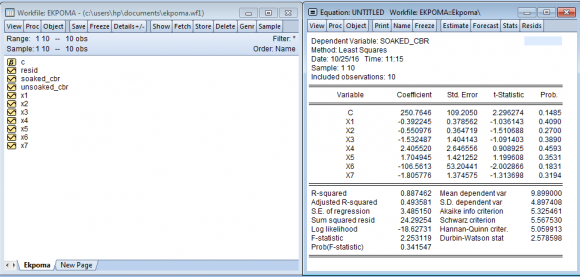
8. b) Regression Modelling
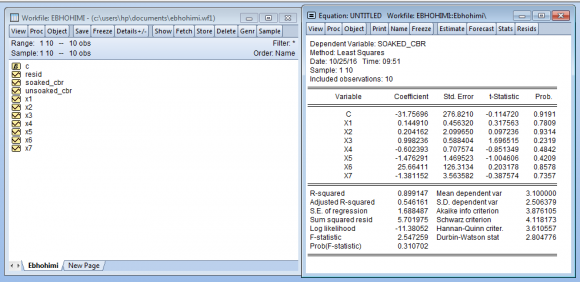
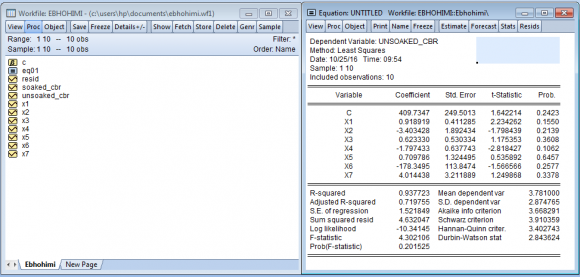
For this analysis, geotechnical properties including sieve analysis, liquid limit, plastic limit, plastic index, optimium moisture content and maximum moisture content were taken as independent variables as shown in tables 4 and 5while CBR soaked and unsoaked were taken as the dependent variables.To conduct the multivariate linear regression and solve the regression equation, multivariate statistical software Eview 9.0 was employed. The interphase of the statistical software containing both the dependent and independent variables is presented in tables 6 and 7 representing both the soaked and unsoaked CBR respectively. For ease of data transformation, the selected independent variables were coded as follows
9. Analysis Test Results of soaked and un-soaked CBR for Ebhohimi samples
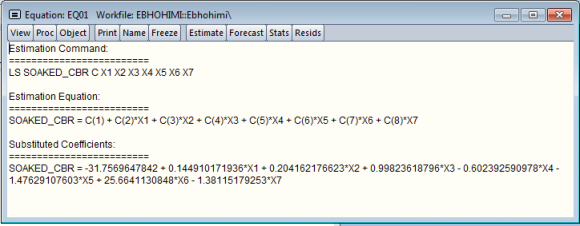
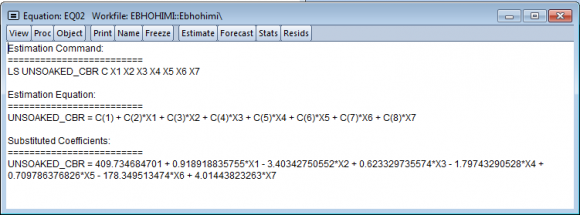
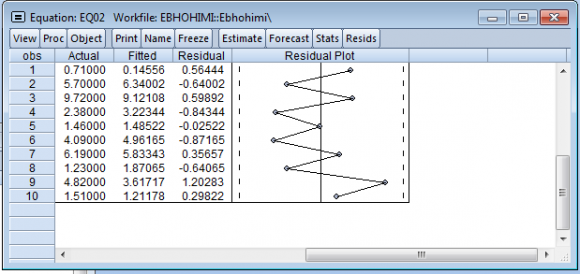
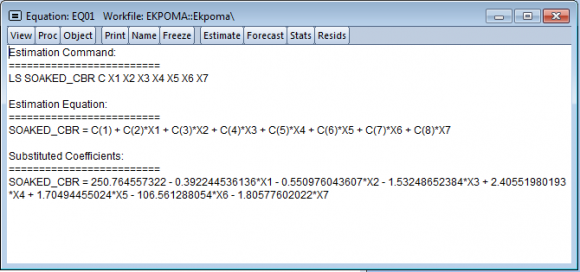
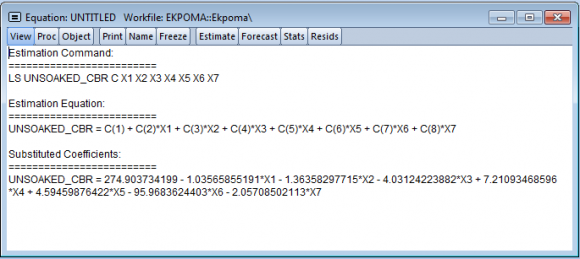
From the result of Tables 6 and 7, it was observed that the coefficient of determination (R 2 ) differs for both the soaked and the unsoaked CBR analysis (0.899147 and 0.937723) respectively. The explanation is that the selected independent variables (percent passing 0.075mm sieve size, percent passing 0.425mm sieve size, liquid limit, plastic limit, plastic index, maximum dry density and optimum moisture content) had a better correlation with the unsoaked CBR than the soaked CBR. In addition, the high coefficient of determination as observed revealed the suitability of multivariate linear regression model in explaining the dependence of the independent variables on the regressor. Normally, this would imply a very good fit for the model. Thereafter, multivariate linear regression equation was developed as shown in Figure 2 and 3. The same procedure in Figure 2 applies here. Multiple linear regression equation was developed using the estimated parameters and the substituted coefficients are as shown in Figure 3 which represent the unsoaked CBR. The "Cs"are the soaked CBR coefficient, while X1, X2?Xn are the independent variables ( X1 = % 0.075mm sieve, X2 = % 0.425mm sieve, X3 = LL (%), X4 = PL (%), X5= PI (%), X6 = MDD (g/cm 3 ), X7= OMC (%)). The values were substituted and equation 3 was derived. Thereafter, a graphical visualization was done, the graphical representation of soaked and unsoaked CBR for Ebhohimi sample, as shown in Figures 4 and 5. ii.
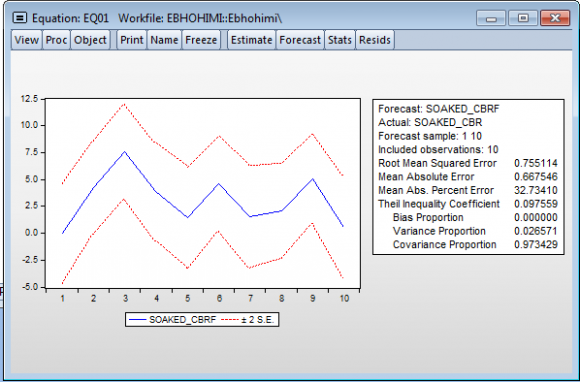
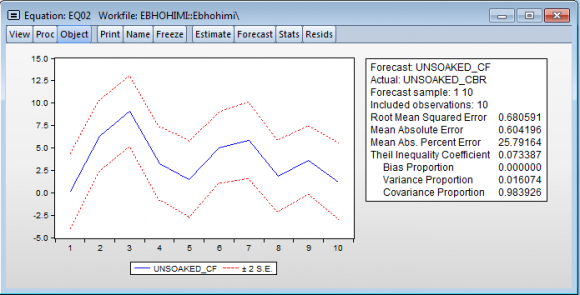
10. Statistics of fit based on 95% upper and lower bounds for soaked and unsoaked CBR
The computed statistics of fit based on 95% lower and upper bounds was visualized graphically as presented in Figures 4 and 5
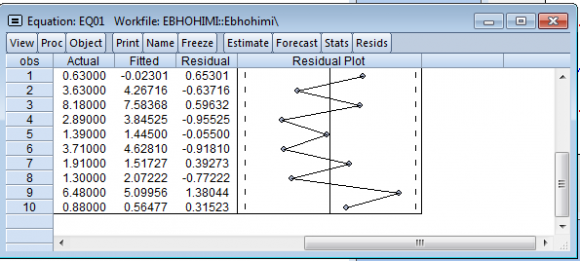
11. Comparison of Actual and Predicted CBR Values
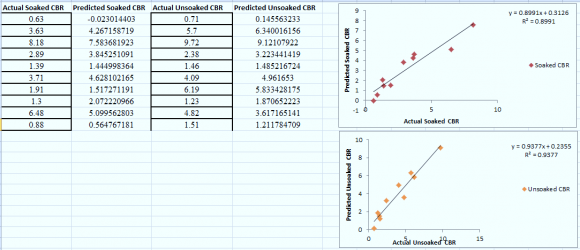
From the statistical prediction figures 6 and 7 which shows the actual and predicted soaked and unsoaked CBR based on the multivariate regression approach, it is observed that the actual CBR values and predicted CBR value for both soaked and unsoaked are relatively close, the highest variation is 1.38. To assess the strength of multivariate linear regression analysis in predicting the soaked and unsoaked CBR of the soil based on selected geotechnical parameters, a linear regression of output was done using the actual and predicted soaked and unsoaked CBR as the dependent and independent variables. Result obtained are presented in Figure 8. A plot was made between experimental and predicted values of CBR as shown in Figure 8 It is clear from this figure that most of the predicted CBR values are close to the reported experimental soaked CBR values. As the Actual CBR in soaked and the unsoaked increases, predicted CBR values also increases, indicating linear relationship exists between them. Considering the square of coefficient of correlation (R 2 ) for both is found to be 0.8991 (soaked) and 0.9377 unsoaked, there is evidence that a good correlations exist.
12. c) Ekpoma sample
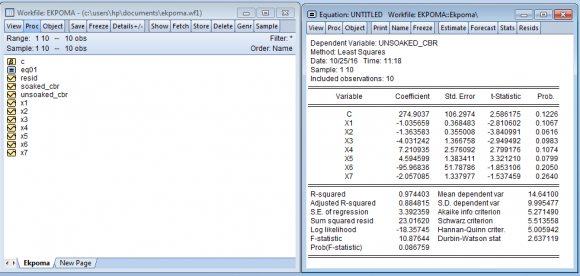
The input data for Ekpoma analysis is shown in Table 9. 9 and 10, it was observed that the coefficient of determination (R 2 ) differs for both the soaked and the unsoaked CBR analysis (0.887462 and 0.974403). The selected independent variables (percent passing 0.075mm sieve size, percent passing 0.425mm sieve size, liquid limit, plastic limit, plastic index, maximum dry density and optimum moisture content) had a better correlation with the unsoaked CBR than the soaked CBR. In addition, the high coefficient of determination as observed revealed the suitability of multivariate linear regression model in explaining the dependence of the independent variables on the regressor. From the results, it was observed that 88.7462% and 97.4403% of the variation in the soaked and unsoaked CBR can be explained by the selected independent variables. Thereafter, multivariate linear regression equation was developed as are shown in The statistical prediction table which shows the actual and predicted soaked and un-soaked CBR based on the multivariate regression approach is presented in figures 13 and 14 respectively. The statistical prediction table which shows the actual and predicted soaked and un-soaked CBR based on the multivariate regression approach is presented in Figures 13 and 14 respectively. To assess the strength of multivariate linear regression analysis in predicting the soaked and unsoaked CBR of the soil based on selected geotechnical parameters, a linear regression of output was done using the actual and predicted soaked and unsoaked CBR as the dependent and independent variables. Result obtained is presented in Figure Statistical parameters such as coefficient of multiple determinations (R 2 ), standard deviation (?), standard error (SE), Adjusted R 2 , and mean (µ) of estimated and measured values obtained after multivariate analysis were determined for both soaked and unsoaked CBR for Ebhohimi and, Ekpoma. Comparing the soaked and unsoaked CBR values of these two locations, it was observed in Table 11, that Ekpoma sample has a higher determination coefficient (R 2 ) of 0.9744 for unsoaked CBR as a function of independent variables (LL, PI, MDD, OMC, 0.075mm and 0.425mm sieve) and Ebhohimi sample has a higher determination coefficient (R 2 ) of 0.8991 for soaked CBR, which is also as a function of the independent variables. This means that the model has a higher coefficient of determination compared with un-soaked CBR. IV.
13. Conclusion
From this study, it was observed that the regression model was able to capture the relation between index properties of soils and the soaked and unsoaked CBRs. At Ebhohimi site, the coefficient of regression with values predicted from the developed regression model and experimentally obtained values were found to be high (Soaked was observed to be 0.89 and the unsoaked is 0.93). Ekpoma (R 2 ) was observed to be 0.88 for the soaked and 0.97 for the unsoaked.
The results of the analysis indicate that there is a close relationship between experimental CBR values and the predicted CBR values.
However, the results show that more than half of the sample materials do not satisfy the requirement for both road base and subbase. Some of the materials can only be used as subgrade materials only after thorough compaction by several passes with vibratory roller or excavation and replacement with suitable fill material has been carried out.


| S/N | Location | Number of Samples Collected | Depth / Chainage |
| 1 | Ebohimi borrow pit | 10 | 1 to 3m |
| 2 | Ekpoma road /BP | 10 | 0.6-3m&43+230 -65+100 |
| Regression Modelling of California Bearing Ratio (CBR) Predicted from Index Properties for Lateritic |
| Soils |
| Year 2019 | ||||||||||||
| ) Volume XIx X Issue IV V ersion I | S/N | Sample Location | %Passig 0.075mm (no 200) | %Pas sing 0.425 mm | Liquid Limit ( %) | Plastic Limit (%) | Plastic ity Index (%) | MDD (g/cm 3 ) | OMC (%) | CBR Soaked ( %) | CBR Unsoa ked ( %) | ASSHTO Soil Classificat ion |
| Journal of Researches in Engineering ( E | 1 2 3 4 5 6 | EkpomaUjio ba RD,1.4m EkpomaUjio ba 0.65m Ekpoma Borrow pit 1 0.75m Ekpoma Borrow pit 2 0.75m Ekpoma Borrow pit 2 1.5m Ekpoma Borrow pit 3 | 36.06 24.32 36.89 22.15 23.14 21.13 | 68.35 65.85 67.99 73.16 75.49 76.44 | 53.32 43.81 36.74 27.76 41.52 35.76 | 19.00 15.86 15.51 13.43 13.70 15.18 | 34.32 27.95 21.23 14.33 27.55 20.58 | 1.59 1.62 1.78 1.69 1.72 1.76 | 18.6 19.3 8 10.8 13.2 14.9 13.6 0 | 18.2 6.34 10.9 8.85 3.48 17.6 | 32.49 11.4 12.8 12.8 10.2 33.2 | A-7-5 A-6 A-2-6 A-2-6 A-2-6 A-7-5 |
| Global | 7 | 1.5m Ekpoma 50+500 | 40.44 | 74.7 | 45.80 | 25.2 | 14.29 | 1.59 | 16.0 | 8.29 | 10.1 | A-7-5 |
| 8 | Ekpoma 43+230 | 40.74 | 78.75 | 33.80 | 19.74 | 14.06 | 1.65 | 14.0 | 9.03 | 11.1 | A-6 | |
| 9 | Ekpoma 47+500 | 36.23 | 77.43 | 29.38 | 17.45 | 11.92 | 1.71 | 13.6 | 4.99 | 5.09 | A-6 | |
| 10 | Ekpoma 65+100 | 29.35 | 73.32 | 43.81 | 15.86 | 27.95 | 1.62 | 19.4 | 7.43 | 12.67 | A-2-6 | |
| © 2019 Global Journals | ||||||||||||
| S/No. | Variable Code | Variable Definition |
| 1 | X1 | % Passing 0.075mm sieve |
| 2 | X2 | % Passing 0.425mm sieve |
| 3 | X3 | Liquid limit (%) |
| 4 | X4 | Plastic limit (%) |
| 5 | X5 | Plastic index (%) |
| 6 | X6 | Maximum dry density (g/cm3) |
| 7 | X7 | Optimum moisture content (%) |
| X1 | X2 | X3 | X4 | X5 | X6 | X7 | SOAKED CBR | UNSOAKED CBR |
| 44.1 | 66.2 | 57.49 | 18.57 | 38.92 | 1.81 | 16.92 | 0.63 | 0.71 |
| 48.1 | 69.8 | 56.28 | 15.5 | 35.92 | 1.75 | 17.30 | 3.63 | 5.70 |
| 42.1 | 64.1 | 54.75 | 16.4 | 38.5 | 1.72 | 14.30 | 8.18 | 9.72 |
| 38.2 | 61.08 | 46.31 | 16.97 | 29.34 | 1.74 | 14.30 | 2.38 | 2.89 |
| 50.66 | 73.35 | 56.45 | 26.11 | 30.78 | 1.65 | 19.76 | 1.39 | 1.46 |
| 46.4 | 66.8 | 54.49 | 23.71 | 30.78 | 1.65 | 15.20 | 3.71 | 4.09 |
| 49.1 | 67.2 | 58.17 | 21.23 | 36.94 | 1.75 | 16.81 | 1.91 | 6.19 |
| 49.9 | 68.5 | 53.04 | 19.46 | 33.58 | 1.75 | 17.34 | 1.23 | 1.30 |
| 44.5 | 64.9 | 46.31 | 20.19 | 26.12 | 1.68 | 15.54 | 4.82 | 6.48 |
| 52.16 | 75.01 | 54.64 | 19.78 | 34.88 | 1.65 | 17.40 | 0.88 | 1.51 |
| X1 | X2 | X3 | X4 | X5 | X6 | X7 | SOAKED CBR | UNSOAKED CBR |
| 36.06 | 68.35 | 53.32 | 19 | 34.32 | 1.59 | 18.6 | 17.6 | 33.2 |
| 24.32 | 65.85 | 43.81 | 15.86 | 27.95 | 1.62 | 19.38 | 18.2 | 32.49 |
| 36.89 | 67.99 | 36.74 | 15.51 | 21.23 | 1.78 | 10.8 | 6.34 | 11.4 |
| 22.15 | 73.16 | 27.76 | 13.43 | 14.33 | 1.69 | 13.2 | 10.9 | 12.8 |
| 23.14 | 75.49 | 41.52 | 13.7 | 27.55 | 1.72 | 14.9 | 8.85 | 12.8 |
| 21.13 | 76.44 | 35.76 | 15.18 | 20.58 | 1.76 | 13.6 | 3.48 | 10.2 |
| 40.44 | 74.7 | 45.8 | 25.2 | 14.29 | 1.59 | 16 | 8.29 | 10.2 |
| 40.74 | 78.75 | 33.8 | 19.74 | 14.06 | 1.65 | 14 | 9.03 | 11.1 |
| 36.23 | 77.43 | 29.38 | 17.45 | 11.92 | 1.71 | 13.6 | 4.99 | 5.09 |
| 29.35 | 73.32 | 43.81 | 15.86 | 27.95 | 1.62 | 19.4 | 7.43 | 12.67 |
| Location | Model (Y) | R 2 | Adjusted R 2 | Standard Deviation (?) | Standard Error (SE) | Mean (µ) |
| Ebhohimi CBRs | 0.8991 X + 0.3126 | 0.8991 | 0.5461 | 2.5063 | 1.6884 | 3.1000 |
| Ebhohimi CBRu | 0.9377 X + 0.2355 | 0.9377 | 0.7197 | 2.8747 | 1.5218 | 3.7810 |
| Ekpoma CBRs | 0.8875 X + 1.114 | 0.8874 | 0.4935 | 4.8974 | 3.4851 | 9.8990 |
| Ekpoma CBRu | 0.9744 X + 0.3748 | 0.9744 | 0.8848 | 9.9954 | 3.3923 | 14.641 |
| Journal of Researches in Engineering | |||||||||||
| Global | |||||||||||
| Sample No. | BP1 | BP2 | BP3 | BP4 | BP5 | BP6 BP7 | BP8 | BP9 BP10 | |||
| Experimental Value of CBRs | 0.63 | 3.63 | 8.18 | 2.38 | 1.39 | 3.71 | 1.91 | 1.30 | 4.82 | 0.88 | |
| Ebhohimi | Predicted value of CBRs | 0.02 | 4.26 | 7.58 | 3.84 | 1.44 | 4.62 | 1.51 | 2.07 | 5.09 | 0.56 |
| Experimental Value of CBRu | 0.71 | 5.70 | 9.72 | 2.89 | 1.46 | 4.09 | 6.19 | 1.23 | 6.48 | 1.51 | |