1. Introduction
lthough industrialization is inevitable, various devastating ecological and human disasters which have continuously occurred over the last three decades or so implicate industries as major contributors to environmental degradation and pollution problems of various magnitudes. Rapid industrial developments in developed and developing countries have increased hazardous wastes generation several fold (Fridrikhsberg,1984).
Wastewater is any water that has been adversely affected in quality by anthropogenic influence. It comprises liquid waste discharged by domestic residences, commercial properties, industry, and/or agriculture and can encompass a wide range of potential contaminants and concentrations. In the most common usage, it refers to the municipal wastewater that contains a broad spectrum of contaminants resulting from the mixing of wastewater from different sources. Jagadeesh, (2006) and Ademoroti,(1996).
Industrial and municipal wastewaters frequently contain varied concentrations of organics and heavy metal ions that can be harmful to aquatic life and human health. The conventional methods for treating such wastewaters are expensive. Consequently, the search for unconventional but effective and economical methods for the treatment and removal of organics and heavy metal ions has been on the increase in recent times. The use of natural wastes as adsorbents for organics and metal ions is being exploited because of their availability and low cost. Agricultural materials that have been investigated as adsorbents for metal ions in solutions include walnut waste (Randall et al, 1974), peanut skin (Randall et al,(1975), cotton (Roberts and Rowland,1973), sugar cane waste (Kumar and Dara,(1992) rice straw (Marshall and Champagne,1995), palm kernel shell (Ebhoaye and Oyesola (2004) and maize cob and cassava peels in the removal of organics (Ewansiha et al,(2005). Several researches have equally reported on the use of modified agricultural wastes in the sorption of metal ions from solutions (Okieimen et al, (1991); (Okuo and Ozioke,(2001); (Okieimen and Ebhoaye,(1986).
In general, there are various technological methods existing for the treatment of wastewater. Such methods include chemical precipitation, ion exchange, adsorption, membrane processes, supercritical fluid extraction, bioremediation and Oxidation with oxidizing agent. However, most of these technologies are either extremely expensive or not readily available. Efficient and environment friendly methods are thus needed to be developed for the treatment of wastewater. It has been observed that adsorption among others is a cost effective technique and easy to operate.
Heavy metals: It is often used as a group name for metals and semimetals (metalloids) that have been associated with contamination and potential toxicity or ecotoxicity .They have high utilities in industrial applications from papers to automobiles by their very characteristics properties. They are found in the deep bowels of the earth as ores. The metals are segregated from these ores, leaving behind the tailings that find their way into the environment as toxic pollutants. They get into the water bodies directly from point sources as sewage and non-point sources as runoff and through atmospheric deposition that are transported from long distances. Heavy metals affect every level of the food web, from producers in the trophic levels to the highest order carnivore by residing in the system and magnifying at every trophic status.
Bacteria count represent one aspect of water quality, it is a microbiological procedure which uses samples of water and from these samples determine the concentration of bacteria. This is an indicator of possible presence of pathogenic micro-organisms.
The number of pathogens in sewage contaminated water is a function of number of persons who excrete such organisms.
Biological characteristics: these have to do with the following: i. The principal group of micro-organism found in surface water and wastewater as well as those responsible for biological treatment ii. Pathogenic organisms found in wastewater iii. The organism used as indicator of pollution and their significance iv. The method used to enumerate the indicator organism v. The method used to enumerate the toxicity of treated waste water.
2. a) Adsorption
Adsorption is the accumulation of substances on the surface of a solid or liquid. The surface area of the adsorbent play an important role. The larger the surface area, the greater the extent of adsorption.
Adsorption is of two types, namely physical adsorption and chemical adsorption or chemisorption (Negi and Anad (2007) The adsorbent that will be used in this research are Activated Carbons prepared from bamboo culms, and periwinkle shells. Activated carbon: This is also called activated charcoal. It is a form of carbon that has been processed to make it extremely porous and thus have a very large surface area available for adsorption or chemical reaction (CPL Caron link, (2008). The adsorptive property is due to its high degree of micro porosity in that just one gram of activated carbon has a surface area of approximately 500m 2 as determined typically by nitrogen gas adsorption. Sufficient activation for useful applications may come solely from the high surface area though further chemical treatment often enhances the adsorbing properties of the material. Activated carbon is usually derived from charcoal and are the most common adsorbents used for the removal of organic compounds from air and aqueous waste streams (Tsai,Chang,and Lee 1997) . Any material with high carbon content and low in organics can be used as precursor in the production of activated carbon (Donnet et al, 1988). Literature survey indicates that there have been many attempts to obtain activated carbons or adsorbents from agricultural wastes such as coconut shells (Mortley et al, 1988, Lavne et al, 1989). Almond shell (Philip andCirgis, 1996, Gergov et al,1994)
3. Statistical Models a) Response Surface Methodology
In statistics, response surface methodology (RSM) explores the relationships between several explanatory variables and one or more response variables. The method was introduced by Box and Wilson (1951). The main idea of RSM is to use a sequence of designed experiments to obtain an optimal response. Box and Wilson suggest using a seconddegree polynomial model to do this. They acknowledge that this model is only an approximation, but used it because such a model is easy to estimate and apply, even when little is known about the process (Asadi and Hamid, 2017)
Statistical approaches such as RSM can be employed to maximize the production of a special substance by optimization of operational factors. In contrast to conventional methods, the interaction among process variables can be determined by statistical techniques. Response surface methodology has an effective track-record of helping researchers improve products and services.
4. b) Analysis of variance
Analysis of variance (ANOVA) is a collection of statistical models used to analyze the differences among group means and their associated procedures (such as "variation" among and between groups), developed by statistician and evolutionary biologist Ronald Fisher. In the ANOVA setting, the observed variance in a particular variable is partitioned into components attributable to different sources of variation. In its simplest form, ANOVA provides a statistical test of whether or not the means of several groups are equal, and therefore generalizes the t-test to more than two groups. ANOVAs are useful for comparing (testing) three or more means (groups or variables) for statistical significance. It is conceptually similar to multiple twosample t-tests, but is more conservative (results in less type I error) and is therefore suited to a wide range of practical problems. ANOVA is used in the analysis of comparative experiments, those in which only the difference in outcomes is of interest. The statistical significance of the experiment is determined by a ratio of two variances. This ratio is independent of several possible alterations to the experimental observations. ANOVA is the synthesis of several ideas and it is used for multiple purposes. As a consequence, it is difficult to define concisely or precisely (Gelman, 2005).
5. c) F-test
An F-test is any statistical test in which the test statistic has an F-distribution under the null hypothesis. It is most often used when comparing statistical models that have been fitted to a data set, in order to identify the model that best fits the population from which the data were sampled. Exact "F-tests" mainly arise when the models have been fitted to the data using least squares. The name was coined by George W. Snedecor, in honour of Sir Ronald A. Fisher. Fisher initially developed the statistic as the variance ratio in the 1920s.
6. d) T-test
In statistics, the t-statistic is a ratio of the departure of an estimated parameter from its notional value and its standard error. It is used in hypothesis testing. Most frequently, t statistics are used in Student's t-tests, a form of statistical hypothesis testing, and in the computation of certain confidence intervals. The key property of the t statistic is that it is a pivotal quantitywhile defined in terms of the sample mean, its sampling distribution does not depend on the sample parameters, and thus it can be used regardless of what these may be.
7. e) Optimization
In mathematics, computer science and operations research, mathematical optimization, also spelled mathematical optimisation (alternatively named mathematical programming or simply optimization or optimisation), is the selection of a best element (with regard to some criterion) from some set of available alternatives.
In the simplest case, an optimization problem consists of maximizing or minimizing a real function by systematically choosing input values from within an allowed set and computing the value of the function. The generalization of optimization theory and techniques to other formulations comprises a large area of applied mathematics. More generally, optimization includes finding "best available" values of some objective function given a defined domain (or input), including a variety of different types of objective functions and different types of domains.
An optimization problem can be represented in the following way:
Given: a function f: A R from some set A to the real numbers Sought: an element x 0 in A such that f(x 0 ) ? f(x) for all x in A ("minimization") or such that f(x 0 ) ? f(x) for all x in A ("maximization"). Such a formulation is called an optimization problem or a mathematical programming problem (a term not directly related to computer programming, but still in use for example in linear programming). Many real-world and theoretical problems may be modeled in this general framework. Problems formulated using this technique in the fields of physics and computer vision may refer to the technique as energy minimization, speaking of the value of the function f as representing the energy of the system being modeled.
The function f is called, variously, an objective function, a loss function or cost function (minimization), a utility function or fitness function (maximization), or, in certain fields, an energy function or energy functional. A feasible solution that minimizes (or maximizes, if that is the goal) the objective function is called an optimal solution (Diewert et al., 2008).
In mathematics, conventional optimization problems are usually stated in terms of minimization. Generally, unless both the objective function and the feasible region are convex in a minimization problem, there may be several local minima. A local minimum x* is defined as a point for which there exists some ? > 0 such that for all x where the expression holds; that is to say, on some region around x* all of the function values are greater than or equal to the value at that point. Local maxima are defined similarly. While a local minimum is at least as good as any nearby points, a global minimum is at least as good as every feasible point. In a convex problem, if there is a local minimum that is interior (not on the edge of the set of feasible points), it is also the global minimum, but a non-convex problem may have more than one local minimum not all of which need be global minima.
8. III.
9. Materials and Methods
10. a) Adsorbent preparation and characterization
Matured bamboo culms were harvested and cut into small strips with saw blade. Samples of 1kg each were weighed and heated to 500? for three hours using the METM-525 Muffle furnace. The carbonized culms were then milled to fine powder, and sieved through a mesh size of 150µm. The carbon particles that passed through the screen were collected, characterized and designated as Bamboo culms carbon (BC).
The periwinkle shells were prepared to the desired biosorbents according to the method described by (Aisien et.al, 2014) with some modification. Thus, it was first washed with detergent solution and then with dilute HCl in order to remove soil debris. Then the clean Year 2019
( D D D D )and dry parts were taken in a porcelain crucible and carbonized completely at 900 °C in a muffle furnace for 1 h. The cooled carbon was characterized by standard methods as described by (Ishak and Baker, 1995).
11. b) Preparation of Synthetic Wastewater
The mixed metal ions solution from cation (Cr 2+ ) was prepared from analytical grade stock standard of concentration 1000 ppm. The solution of wastewater was introduced for each metal according to the method of continuous dilution from the sample solution. The pH of the wastewater was adjusted by using HNO 3 1% (V/V) and/or NaOH. The final concentration of metal ions in wastewater was analyzed by atomic absorption spectrophotometer (AAS).
12. c) Analysis of Wastewater
All samples of the simulated waste water prepared above were analyzed as described in the standard methods for the Examination of water and wastewater APHA (1992) and the standard methods for water and effluents analysis, (Ademoroti, 1996).
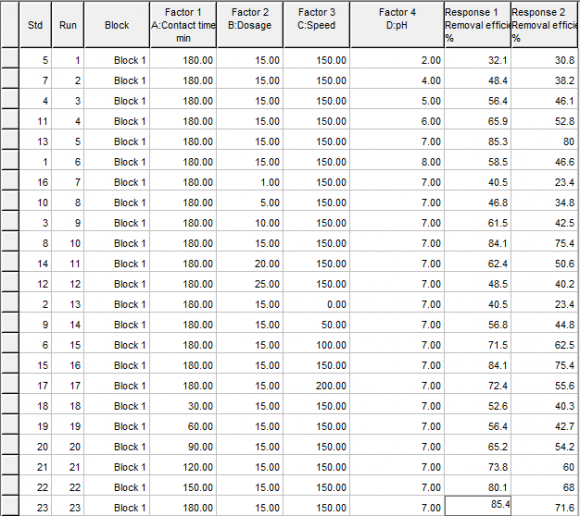
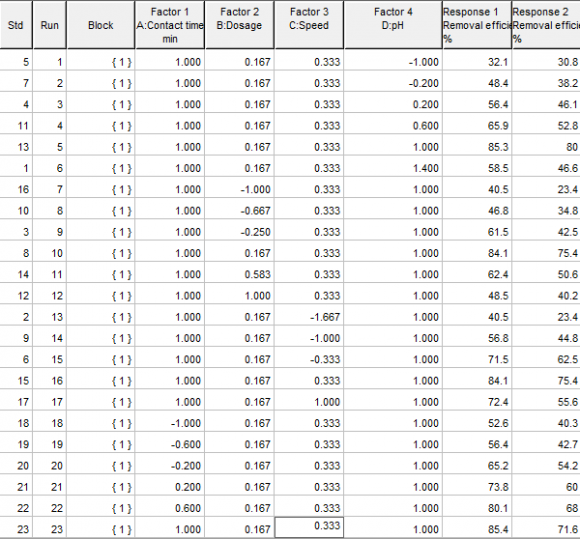
13. d) Statistical modeling and optimization
The response surface (statistical) study and optimization will be done using the statistical toolbox of Design expert (version 6.0.6) software for statistical modeling, analysis of variance, surface response study and optimization. The study will be done for the experimental data using contact time (A), dosage (B), agitation speed (C) and pH (D) as factors, with the metal ion removal efficiency (y) as response. The same procedure will be applied to study and optimize the removal efficiency of Chromium (Cr), Lead (Pb) and Cadmium (Cd) contaminants using bamboo carbon (ABC) and periwinkle shell carbon (APS) respectively as adsorbents.
The experimental data (factors and response) will be fit to four response surface models for each adsorbent-adsorbate pair: Linear Model:
?? = ?? + ???? 1 + ???? 2 + ???? 3 + ???? 4(1)Interaction Model:
?? = ?? + ???? 1 + ???? 2 + ???? 3 + ???? 4 + ð??"ð??"?? 1 ?? 2 + ð??"ð??"?? 1 ?? 3 + ??? 1 ?? 4 + ???? 2 ?? 3 + ???? 2 ?? 4 + ???? 3 ?? 4(2)Pure-quadratic model:
?? = ?? + ???? 1 + ???? 2 + ???? 3 + ???? 4 + ð??"ð??"?? 1 2 + ð??"ð??"?? 2 2 + ??? 3 2 + ???? 4 2(3)Quadratic model:
?? = ?? + ???? 1 + ???? 2 + ???? 3 + ???? 4 + ð??"ð??"?? 1 ?? 2 + ð??"ð??"?? 1 ?? 3 + ??? 1 ?? 4 + ???? 2 ?? 3 + ???? 2 ?? 4 + ???? 3 ?? 4 + ???? 1 2 + ???? 2 2 + ???? 3 2 + ???? 4 2(4)The model that best fits, based on the adjusted R-squared (closest positive value to 1), will be considered the statistical model that best describes the adsorption phenomenon and will be used for optimization to determine optimum conditions for the process.
The value of the R-squared will be used as a measure of model accuracy and the closer the values are to unity, the more accurate the model is. It will also be seen as a measure of variability in the data that the model explains. Its final acceptability will be judged in corroboration with the F-statistics p-value. The p-value of the F-statistics will be used as a measure of model adequacy and a value less than or equal to 0.05 will be acceptable based on 95% confidence interval. The significance of the main effects will be determined using Analysis of variance (ANOVA) which will be judged in a similar way to the F-statistics, using the p-value, while the statistical significance of each factor or their interactions in the model will be determined using the tstatistics value or its associated p-value. As a rule of thumb, T-statistics values with magnitude greater than or equal to 2 will indicate the significance of a factor or their interactions. The p-value of the T-statistics can be used alternatively in a similar way to the p-value of the Fstatistics.
The interaction between the factors will be determined using the surface plots, especially its contour lines and corroborated with the numerical values from t-statistics while the optimization toolbox Design expert (version 6.0.6) will be used for the optimization of factors based on the model.
14. e) Characterization of Bamboo culms based activated carbon
Bamboo culms have been used to produce quality activated carbon, as other biomass, because of their inherent high densities and carbon content. In this study the carbon from the bamboo culms was prepared according to the method described by Ishak and Baker, 1999.
Some of the characteristics of the carbon obtained from bamboo culms are as presented in Table values could cause the inversion of sucrose to non-crystallizable sugars causing lower yields, while alkaline carbon could cause decolouration through alteration of molecular structure of sugar impurities. The value of pH of ABC reported here (6.3) is comparable with the values reported for rubber seed shell carbon (Okieimen et.al., 2005) and rice husk carbon (Okafor and Ujor, 1994).
Bulk density was determined by the tempering procedure described by (Ahmedina et.al, 1997). Bulk density is important when carbon is to be removed by filtration, because it determines that amount of carbon that can be contained in a filter of given solids capacity. Carbons with an adequate density also help to improve filtration rate by forming an even cake on the filter surface (Ahmedina et.al, 1997). The values of bulk density of ABC reported in this study are well within the acceptable range for powdered activated carbon in many applications (B.D 0.67g/cm 3 ) (Babayemi et.al, 2016).
The surface area of ABC was determined by the iodine adsorption method, which is a widely used routine procedure for the determination of surface area of powders. Large surface area is a requirement for good adsorbent. Surface area is a single most important characteristics of activated carbons designed for adsorption of compounds from liquid media. Report of previous studies (Okieimen et.al, 2005) that attempted to correlate surface area measurements by different methods suggests that the values of iodine number obtained for ABCC represent a fairly large surface area 79.7mg/g. The values of surface area of ABCC are comparable with those reported for rubber seed shell carbon and rice husk carbon (Okieimen et.al, 2005). Negative surface charge 1.79±0.02
15. Characterization of Periwinkle shells carbon
The surface area of periwinkle shell carbon (APS) was determined by the iodine adsorption method: This is a widely used routine procedure for the determination of surface area of powders. Large surface area is a requirement for good adsorbent. Surface area is a single most important characteristics of activated Year 2019
( D D D D )carbons designed for adsorption of compounds from liquid media. Report of previous studies (Okieimen et.al, 1991) that attempted to correlate surface area measurements by different methods suggests that the values of iodine number obtained for APS represent a fairly large surface area. The values of surface area of APS are comparable with those reported for rubber seed shell carbon (Okieimen et.al, 2005) and rice husk carbon (Okieimen et.al, 2005; Ejikeme et.al, 2014)
16. f) Surface Charge
The adsorption capacity of carbons is determined by their porous structure and surface area but is also strongly influenced by the presence of functional groups at the surface. Activated carbons are known to contain a variety of hetero atoms such as oxygen, hydrogen, chlorine and Sulphur. Heteroatom's are either derived from the starting material, and become a part of the chemical structure as a result of imperfect carbonization, or chemically bonded to the carbon during activation or during subsequent additional treatments, such as oxidation. These heteroatom's are bound to the edges of the carbon layers and form surface groups that greatly affect the adsorption behavior of the activated carbon, with carbon -oxygen surface structures being by far the most important in influencing surface characteristics (Bansal et.al, 1988;Boehm, 1994).The most common are carboxyl, carbonyl, phenolic hydroxyl, anhydride, ethertype, lactones and lactal. The presence surface oxygen complexes imparts a polar character to the activated carbon surface, which should affect preferential adsorption of polar organic solutes.
Loss on ignition of carbon is the residue that remains when the carbonaceous portion is burned off. The ash consists mainly of minerals such as silica, aluminum, iron, magnesium and calcium. Loss of ignition in activated carbon is not desirable and is considered on impurity. Ash leached into sugar liquor during the process of decolorisation is known to cause uneven distribution of heat in the boiler during sugar crystallation. Loss of ignition may also interfere with carbon adsorption through competitive adsorption and catalysis of adverse reactions. For instance, the loss of ignition may affect the pH of the carbon since the pH of most commercial carbons is provided by their inorganic components. Usually, materials with the lowest loss of ignition produce the most active products.
The value obtained for the carbon is 51.0%; this result is an indication of the level of impurity present in it. (Zadok, 1985;Meites, 1963)
17. Table 4.3
Bulk density is important when activated carbon is to be removed by filtration, because it determines that amount of carbon that can be contained in a filter of given solids capacity. Carbons with an adequate density also help to improve filtration rate by forming an even cake on the filter surface (Ahmedna et.al, 2000). The values of bulk density of APS reported in this study are well within the acceptable range for powdered activated carbon in many applications (B.D 0.23g/ml), Table 4
18. g) Adsorption Isotherms Studies
Two important physiochemical aspects for the evaluation of the adsorption process as a unit operation are equilibria of the adsorption and the kinetics. Equilibria studies give the capacity of the adsorbent.(Olafadehan and Aribike,2000)
The equilibrium relationships between adsorbent and adsorbate are described by adsorption isotherms, usually the ratio between the quantity adsorbed and that remaining in solution at a fixed temperature at equilibrium. Adsorption isotherms are characterized by certain constants and described the mathematical relationship between the quantity of adsorbate and concentration of adsorbate remaining in the solution at equilibrium. In this work, Langmuir, Freundlick and Temkin isotherm models have been used to analyze adsorption data at different concentrations.
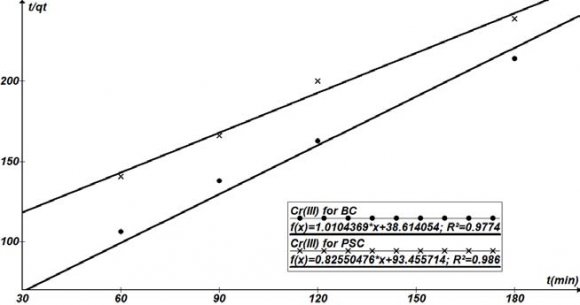
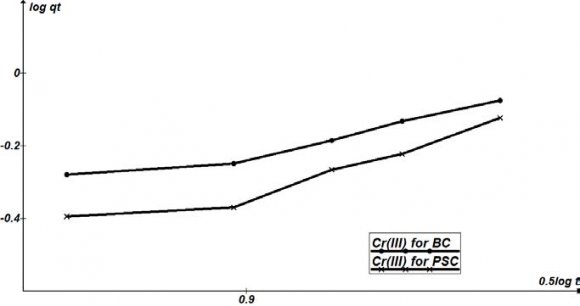
19. h) Sorption Kinetics Studies for Cr 3+ for Bamboo Carbon and Periwinkle Shell Carbon
Except for sorption capacity, kinetic performance of a given bio sorbent is also of great significance for the pilot application. From the kinetic analysis, the solute uptake rate, which determines the residence time required for completion of sorption reaction, may be established. Also, one can know the scale of sorption apparatus based on the kinetic information. Generally speaking, sorption kinetics is the base to determine the performance of fixed-bed or any other flow-through systems. The results obtained from the different studies of the sorption of Cr 3+ by ABC and APS in Table 4.9 show the affinities of the biosorbents for the metal ions. The kinetic properties of the sorbate uptake are required for selecting optimum operating conditions for full scale batch process (Gupta et al, 2010). The kinetic parameter, which is helpful for the prediction of sorption rate, gives important information for designing and modelling sorption processes.
Kinetic models can be helpful to comprehend the mechanism of metal sorption and estimate performance of the sorbents for metal removal. In order to further determine the mechanism of Cr 3+ sorbed onto the biosorbents (ABC and APS), several kinetic models were exploited to discern the controlling mechanism. They included the pseudo first order, pseudo second order, and the intra particle diffusion models. The conformity between the experimental data and the model predicted values were expressed by coefficients of determination (R 2 ).
Different kinetic parameters calculated by linear regression for Cr 3+ initial concentrations are summarized in Table 4.9. Plots of pseudo first order , pseudo second order, and intraparticle models are shown in Figures 4.11 4.9, the coefficients of determination (R 2 ) obtained from the plots of pseudo first and second orders kinetics were higher (R 2 >0.9) for both ABC and APS, than those of the intraparticle model.
It can also be seen in Table 4.9 that, the rate constant (k 2 ) of ABC is higher for both Cr 3+ . A similar observation has also been reported by earlier researhers (Allen et al., 2005, Liu et al., 2012).
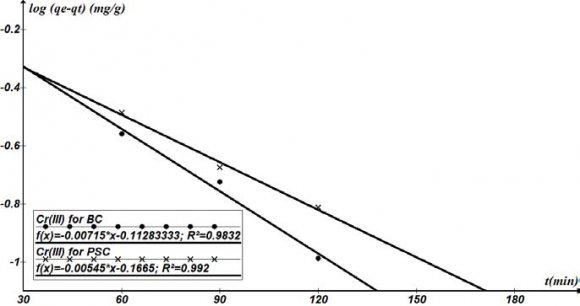
The results of the sorption of Cd 2+ , Pb 2+ and Cr 3+ on to the biosorbents have been represented in the form of the pseudo first order equation in Figures 4.10 to 4.12. From these plots, a linear relationship between In(qe-qt) and t was established with high correlation coefficients (R 2 =0.9) for Cd 2+ and Cr 3+ with both ABC and APS and (R 2 =0.98 & 0.96) for Pb 2+ for both ABC and APS respectively. This show that the model can be applied and is appropriate to described the entire process. These plots showed different distinct linear regions within individual sets of data also for the pseudo second order model.
The applicability of the pseudo second order kinetic model to experimental data is presented in Table 4.9. The deviation between the calculated qe values and the experimental qe values were relatively low and a regression coefficient of 0.97-0.98 shows that the model can be applied for the sorption. Lagergren Pseudo first order q e ,exp(mg/g)q e ,calc(mg/g )K 1 x 10 -3 (hr -1 )R 2 0.841(0.754)0.771(0.682) 16.466(12.551)0.9832(0.992 0)
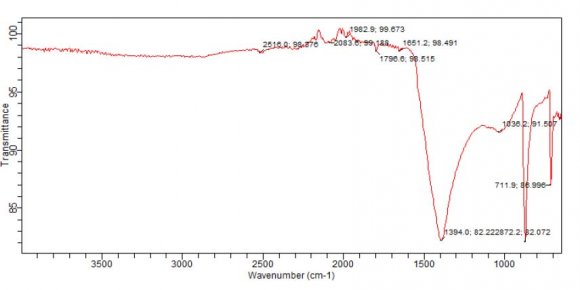
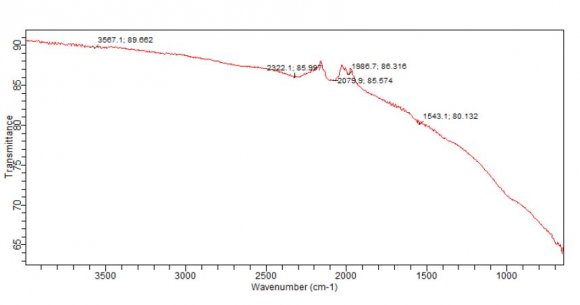
Pseudo Second Order q e , calc(mg/g) K 2 x10 -2 (hr - Fourier Transform Infrared Spectroscopy was carried out in order to identify the functional groups present in activated carbon. Functional groups of adsorbents not only affect the adsorption behavior but also dominate the adsorption mechanism. The spectra of adsorbent were measured in the range of 4000cm-1 to 500cm-1wave number. The FT-IR spectrum reveals the complex nature of the adsorbent as evidence by the presence of a large number of peaks .The FT-IR spectrum of ABC as shown in the figure 4.21, shows absorption bands at 2516 /cm ,a carboxylic O-H and S-H thiols, a C-C triple bond at 2084 /cm, a C=O (acyl and halides) at 1797/cm, an alkene C=C , amines and amides at 1651/cm, a C-O-C at 1036 /cm, a C-C single bond (alkane functional group) at 872/cm and -S-OR (esters) at 712/cm. All these show that APS, with so many functional groups on it will be able to attracts most of the cations desired to be removed from the waste effluent.
20. Global Journal of Researches in Engineering
IV.
21. Model Adequacy Checking
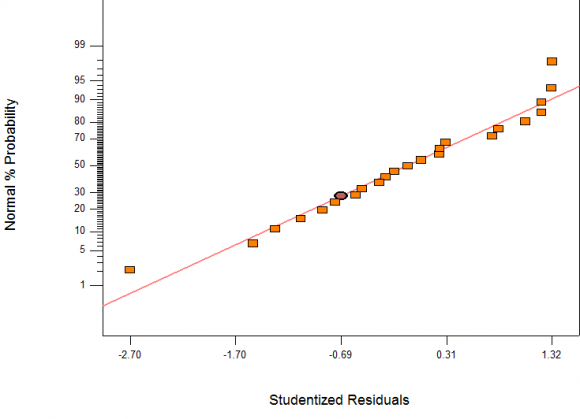
After developing model equations, checking its adequacy is necessary for how properly fitted is the predicted data to the experimental data, to know the errors or deviation known as residuals which can be studentized.
The statistical tools used were R 2 , R
22. a) Model Validation using Graphical Approach
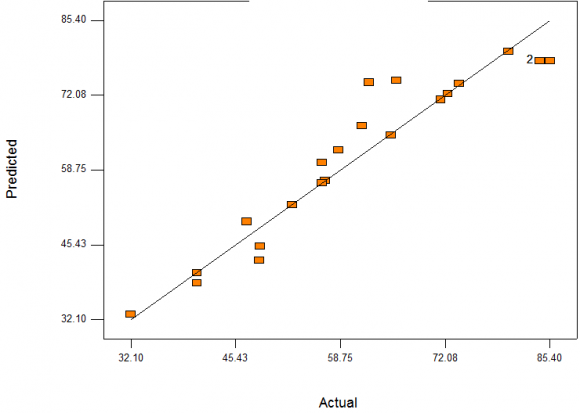
Validation of developed models is important to ensure that the models satisfactorily describe the behaviour of the system being modelled. Validation of models can be done using graphical or numerical approach. Graphical method was used in this work to validate the developed models. As it is advantageous over other due to illustration of a broad range of relationship existing between model and data used. In Figures 4. 23 The following equations were generated using quadratic model of the software and were all in terms of coded factors as written. along 45 degrees line (straight line). Also, the normal probability plots of studentized residuals shown on Figure 4.23 and 3 show that residuals behave as expected and it implies that errors are evenly distributed as the points fell on straight lines. These further imply that the models fit the data adequately (goodness of fit).
23. Removal efficiency of
24. Conclusion
The adsorption of Chromium using Bamboo carbon (ABC) and Periwinkle shell carbon (APS) has been modeled and studied statistically using a purequadratic statistical model and the model was adequate for all cases.
Bamboo carbon showed higher removal efficiency than Periwinkle shell carbon in the range of 3-6%.
Dosage and agitation speed had the most significant effect on removal efficiency, with optimum dosage falling in the range of 12.9-16.2 mg/l, while range of optimum agitation speed could be from 138-200 rpm, which was the maximum used.
The maximum removal efficiencies of the carbon samples in heavy metal removal were least for Chromium, higher for Lead, with Cadmium having the highest removal efficiency. These removal efficiencies varied from 63.3-102.83% for APS and from 84-100.7% for ABC.


| D D D D ) |
| ( |
| © 2019 Global Journals |
| Characteristics | Values |
| pH of slurry at 28? | 6.5 ±0.2 |
| Bulk density(g/ml) | 0.23±0.05 |
| Surface area(m 2 /g) | 318.84 |
| Langmuir surface area (m 2 /g) | 5584.66 |
| BJH method | 766 |
| DH method cum | 827 |
| DFT cum. Surface area | 67.9 |
| Pore volume(cm 3 /g) | 0.16 |
| Attrition (%) | 25.5±0.1 |
| Conductivity(? -1 m -1) | 111.5±12.2 |
| Loss on Ignition (%) | 51.0±0.5 |
| Comparative Analysis of Heavy Metal Removal using Activated Bamboo and Periwinkle Shell, a Case Study of | ||||
| Cr (III) ion. | ||||
| Year 2019 | ||||
| D D D D ) C | ||||
| ( | ||||
| Parameters | Units | Wastewater | FEPA limits | WHO limits (WHO,1973) |
| Turbidity | NTU | 027.33±2.00 | 5.00 | 5 |
| P H | 8.10±0.01 | 6.00-9.00 | 6.5 to 8.5 | |
| Colour | Hazen | Blueish | - | 15 |
| Odour | Slightly offensive | Unobjectable | ||
| Temperature | 0C | 37.00±0.10 | <40.00 | 10-30 |
| Conductivity | µs/cm | 935.00±2.00 | 2500.00 | |
| TSS | mg/l | 033.00±1.00 | 30.00 | 10 |
| TDS | mg/l | 445.50±1.45 | 2,000.00 | 1000 |
| TS | mg/l | 478.20±0.01 | 2030.00 | 500 |
| NO 3 -N | mg/l | 13.00±0.01 | 20.00 | - |
| NO 2 -N | mg/l | 0.00±0.00 | 0.50 | - |
| NH 4 -N | mg/l | 0.00±0.00 | 0.50 | - |
| Sulphate | mg/l | 109.00±0.02 | 500.00 | 250 |
| Phosphate | mg/l | 09.11±0.11 | 5.00 | - |
| COD | mg/l | 115.00±1.00 | 80.00 | |
| DO | mg/l | 0.45±0.01 | 5.00 | 4 |
| BOD | mg/l | 00.00±0.00 | 30.00 | 3 |
| Pb | mg/l | 31.68±0.02 | <1.00 | 0.01 |
| Ni | mg/l | 50.00±0.02 | <1.00 | 0.02 |
| Zn | mg/l | 45.05±0.01 | <1.00 | 3 |
| Cu | mg/l | 32.5.±0.05 | <1.00 | 2 |
| Cr | mg/l | 45.00±0.01 | <1.00 | 0.05 |
| © 2019 Global Journals | ||||
| .2. |
| Fig. 4.4: Langmuir Isotherm for Cr adsorption onto ABC and APS |
| Kinetic Model | Parameter | Cr 3+ |
| Sum of Source | Mean Squares | F DF | Square Value | Prob > F | ||||||
| Model | 4247.37 | 8 | 530.92 | 6.65 | 0.0011 significant | |||||
| A | 674.06 | 1 | 674.06 | 8.44 | 0.0115 | |||||
| Year 2019 | B C D | 166.80 126.95 1993.13 | 1 1 1 | 166.80 126.95 1993.13 | 2.09 1.59 24.97 | 0.1703 0.2279 0.0002 | ||||
| A 2 | 99.17 | 1 | 99.17 | 1.24 | 0.2838 | |||||
| B 2 | 1614.99 | 1 | 1614.99 | 20.23 | 0.0005 | |||||
| C 2 | 183.64 | 1 | 183.64 | 2.30 | 0.1516 | |||||
| D 2 | 158.81 | 1 | 158.81 | 1.99 | 0.1803 | |||||
| Residual | 1117.71 | 14 | 79.84 | |||||||
| Lack of Fit | 1116.14 | 11 | 101.47 | 194.20 | 0.0051 | |||||
| Pure Error | 1.573 | 0.52 | ||||||||
| Cor Total | 5365.07 | |||||||||
| Diagnostics Case Statistics table of Actual values vs predicted values for Cr using ABC | ||||||||||
| diagnostics Case Statistics | ||||||||||
| D D D D ) | Standard Actual Order Value | Predicted Value | Residual | Student Leverage Residual | Cook's Distance | Outlier | t | Run Order | ||
| ( | 58.50 | 75.23 | -16.73 | 0.480 | -2.596 | 0.691 | -3.474 | 6 | ||
| 40.50 | 40.12 | 0.38 | 0.846 | 0.107 | 0.007 | 0.103 | 13 | |||
| 61.50 | 69.95 | -8.45 | 0.137 | -1.018 | 0.018 | -1.019 | 9 | |||
| 56.40 | 63.90 | -7.50 | 0.316 | -1.014 | 0.053 | -1.015 | 3 | |||
| 32.10 | 27.81 | 4.29 | 0.929 | 1.800 | 4.703 | 1.978 | 1 | |||
| 71.50 | 69.56 | 1.94 | 0.255 | 0.252 | 0.002 | 0.243 | 15 | |||
| 48.40 | 54.62 | -6.22 | 0.338 | -0.856 | 0.042 | -0.847 | 2 | |||
| 84.10 | 74.20 | 9.90 | 0.101 | 1.168 | 0.017 | 1.185 | 10 | |||
| 56.80 | 58.20 | -1.40 | 0.314 | -0.189 | 0.002 | -0.182 | 14 | |||
| 46.80 | 54.60 | -7.80 | 0.272 | -1.024 | 0.044 | -1.026 | 8 | |||
| 65.90 | 70.42 | -4.52 | 0.189 | -0.562 | 0.008 | -0.548 | 4 | |||
| 48.50 | 49.42 | -0.92 | 0.834 | -0.253 | 0.036 | -0.245 | 12 | |||
| 85.30 | 74.20 | 11.10 | 0.101 | 1.310 | 0.021 | 1.347 | 5 | |||
| 62.40 | 67.36 | -4.96 | 0.176 | -0.612 | 0.009 | -0.597 | 11 | |||
| 84.10 | 74.20 | 9.90 | 0.101 | 1.168 | 0.017 | 1.185 | 16 | |||
| 40.50 | 34.34 | 6.16 | 0.735 | 1.339 | 0.553 | 1.382 | 7 | |||
| 72.40 | 72.13 | 0.27 | 0.756 | 0.061 | 0.001 | 0.059 | 17 | |||
| 52.60 | 49.80 | 2.80 | 0.809 | 0.718 | 0.243 | 0.705 | 18 | |||
| 56.40 | 60.06 | -3.66 | 0.295 | -0.488 | 0.011 | -0.475 | 19 | |||
| 65.20 | 67.64 | -2.44 | 0.350 | -0.338 | 0.007 | -0.327 | 20 | |||
| 73.80 | 72.52 | 1.28 | 0.371 | 0.181 | 0.002 | 0.175 | 21 | |||
| 80.10 | 74.71 | 5.39 | 0.197 | 0.674 | 0.012 | 0.660 | 22 | |||
| 85.40 | 74.20 | 11.20 | 0.101 | |||||||
| 1.321 | 0.022 | 1.361 | 23 | |||||||
| © 2019 Global Journals | ||||||||||
| Year 2019 | |||||||
| 51 | |||||||
| II Version I | |||||||
| Solutions Number 1 | A 160.06 | B 16.62 | C 155.38 | D 6.74 | Removal 81.961 | efficiency Desirability 0.935 Selected | Volume XIX Issue D D D D ) |
| ( | |||||||
| Sum of Source Model A B C D A 2 B 2 C 2 D 2 Residual Lack of Fit Pure Error Cor Total | Mean Squares 4219.21 735.06 393.45 48.45 1259.10 80.27 1663.79 444.51 59.00 1578.38 1564.28 14.11 5797.59 | F 14 DF 8 1 1 1 1 1 1 1 1 12 2 | Square 527.40 735.06 393.45 48.45 1259.10 80.27 1663.79 444.51 59.00 112.74 130.36 7.05 | Value 4.68 6.52 3.49 0.43 11.17 0.71 14.76 3.94 0.52 18.48 | Prob > F 0.0059 significant 0.0230 0.0828 0.5227 0.0048 0.4130 0.0018 0.0670 0.4813 0.0524 not significant | Global Journal of Researches in Engineering | |
| Solutions | ||||||
| No. | A | B | C | D | E(%) | Desirability |
| 1 | 168.10 | 15.141 | 38.80 | 7.00 | 63.3043 | 0.705 Selected |
| 2 | 169.35 | 15.221 | 37.51 | 7.00 | 63.298 | 0.705 |
| 3 | 168.80 | 15.301 | 39.73 | 7.00 | 63.2959 | 0.705 |
| 4 | 166.56 | 14.911 | 39.46 | 7.00 | 63.2879 | 0.705 |
| 5 | 170.81 | 15.011 | 37.23 | 7.00 | 63.2858 | 0.705 |
| 6 | 172.65 | 15.041 | 35.47 | 7.00 | 63.2522 | 0.704 |
| 7 | 175.64 | 15.001 | 36.09 | 7.00 | 63.2093 | 0.703 |