1. Introduction
rbanization is the main cause of changes in hydrological and hydraulic processes and urban flooding. It increases total runoff volume and increases its maximum flow [1][2][3][4]. Land use and land cover changes are affected by attempts to meet human needs such as the construction of residential and industrial facilities Agriculture, mining and other infrastructure, which are key processes associated with the economic and sustainable growth of a particular area, [5] and the proper use of each part of the available land is essential for improving the economic and planning situation of the area without expansion in areas prone to risk is essential for sustainable planning [5,6].
A lot of infrastructure facilities in Saudi Arabia are exposed to the torrential rains and floods that may occur with sever damages to the infrastructure in those areas. That happens due to the rainfall and its consequences as an inflow in the main valleys and their streams. Jizan-Abha Highway recently disclosed to floods that caused several damages of properties, people, and infrastructure along with sunk the most of the near urban settlements.
The used hydrological models to estimate the peak flow and hydrograph curve calculation had developed. That was paralleled with the spatial information sources afforded by remote sensing (RS) technologies. Both of GIS and remote sensing techniques are considering as useful tools since they were integrating the geomorphological terrain and Hydrology along with the land use and land cover. This integration is considered as one of the most important inputs for hydraulic and hydrological modeling. [21].
The Watershed Modeling System program affords an advanced drawing environment to build and operate huge numbers of special mathematical models. Those models are built to hydraulic and hydrological U Land use change plays an important role in the hydrological behavior of drainage basins and affects the local hydrological cycle, several studies have been carried out to evaluate the impact of land use changes on runoff amounts [7][8][9][10][11]. Also, many authors have acknowledged the fact that increasing urban activities in flood plain areas will increase peak discharge, decrease the time to peak, and increase runoff volume [12][13][14][15][16]. A better understanding and evaluation of land use changes that have a direct impact on watershed hydrologic processes has become crucial for planning, management, and sustainable development of the watershed [17][18][19][20]. computations such as; HEC-1, TR-55, TR-20, NSS, HEC-HMS, GSSHA, MODRAT, OC Rational, HSPF, OC Hydrograph, SWMM, Rational method [22].
HEC-HMS modeling achieved a wide prevalence to extract the hydrograph unit for immeasurable basins in dry areas. These models were applied in lots of studies, as Laouacheria and Mansouri [23] used the HEC-HMS model by using a frequented storm to simulate runoff hydrograph in the small urban watershed at Northeast Algeria. Khalil and others used the HEC-HMS model [24], and Muskingum-Cunge approach to computing the lost outflow of secondary watersheds by using GIS-based methods for Al-layth valley at Saudi Arabia.
Syntayah used HEC-HMS model [25], and Snyder Unit Hydrograph to simulate runoff hydrograph the upper basin of the Blue Nile. Norhan and others [26] applied the simulation the runoff and rainfall relationship using HEC-HMS model in the dry environment in Aqiq valley at Medina Al-Monawarah, Saudi Arabia. As well as Sambath and others [27] designed the relationship between rainfall and runoff using HEC-HMS model in the tropical watershed at Sri Lanka, and Meeling and others [28] also used HEC-HMS model to simulate the water runoff at the Semi-arid zone in Northwest China.
Al-Zahrani and others [29] presented a simulation flood model of the watershed in Hafr-Elbaten city, Egypt. That model consists of hydraulic and hydrological models plus using interpretation tools before and after processing operation. Bets Woody Row [30] used the flow model of the kinetic channel and presented a binary propagation wave for the flow of alluvial plain, as to simulate the flood immersion that designed to work with a high accurate grid. Abdel Karim, Ashraf and others [22] adapted a new approach to fix the flood risk insecure urban areas at the Tabouk city, with presenting a suggested mechanism to protect the city by integrated hydrology and hydraulic models. Saudi Arabia officially admitted these models in earlier 2017 through the Ministry of Municipal and Rural Affairs, and the Geological Survey Authority as they are the official responding organizations for certified hydrological studies. Hence the decree No. (28865) had published in 28/3/1438 Hijri to generalize the usage of both WMS and HEC-RAS programs when preparing hydraulic and hydrological studies for preventing the dangers of the flood.
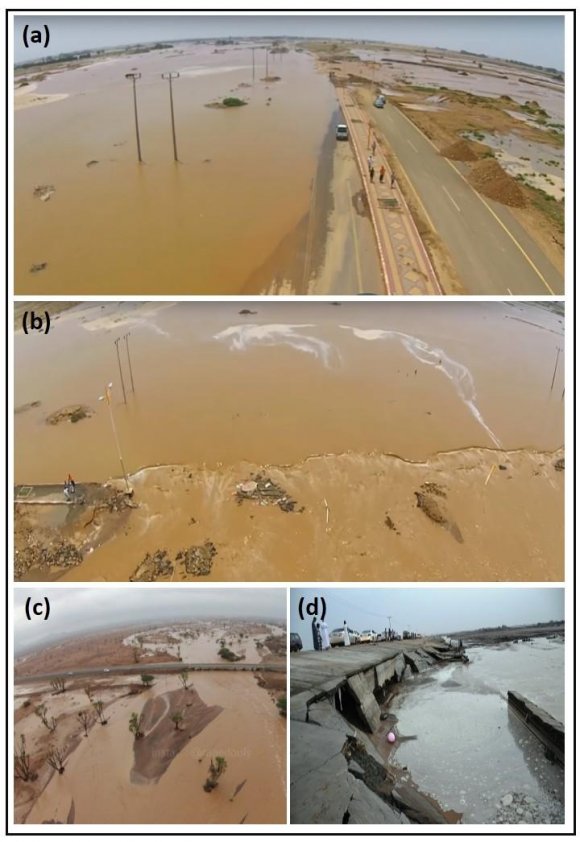
Jizan area witnessed frequented events of flood disasters recently caused by heavy amounts of rainfall in very short duration resulted in wildly velocity inflow streams. The consequences were enormous human and properties losses, as population displacement and destroying farms, buildings, roads, bridges?etc.
Wadi Bayad considers as important Jizan secondary streams, and the opposite road of Wadi Bayad is also accounted as a vital part in Jizan area. Its area, length, and characteristics of the runoff are highly affected in the Jazan-Abha Highway. This area testified frequent floods, and it has been threatened by major dangers to the surrounding urban and villages.
This study developed to assess the effective impact of the sudden flooding on the Jizan-Abha infrastructure as a model for Saudi Arabia's frequent floods. Since the neglecting to develop a flood hazard classification map with the absence of settling the proper proposals, alternatives, and scenarios to mitigate the disaster impact are leading to increasing the loss of the life and properties.
The poor distribution of existing water drainage facilities, such as bridges, line of communication bridge, and dry support bridges under the Jazan-Abha Highway resulting in a significant defect in the draining system. As this causing increasing or decreasing the water drainage system leads to significant damages impacted the path of the road. An inventive approach was developed to dealing with Saudi Arabia's infrastructure flooding risks, which based on GIS, RS, WMS, HEC-HMS, HEC-RAS. This approach proposes preventive alternatives measures in the study area to help mitigate the impact of flooding on the Jizan-Abha Highway, as a model for Saudi Arabia infrastructure projects.
2. II.
3. Area of Study
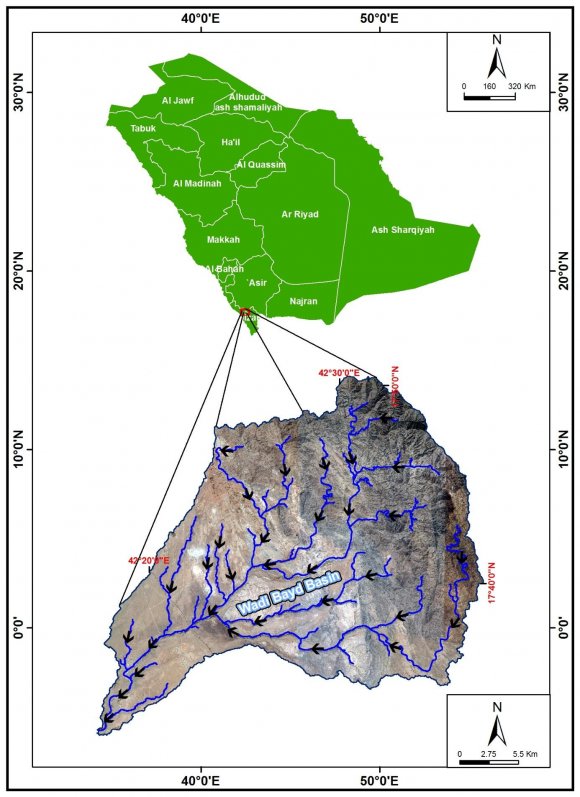
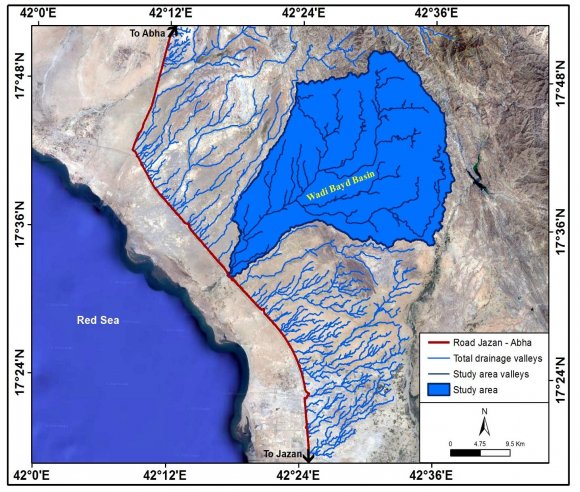
The Jizan-Abha Highway is one of the main transport axes in Saudi Arabia. According to the development of different urban and residential increasing aspects along with the economic growth, Saudi Arabia has developed its transportation sector due to its pivotal role as promoting its network to link Saudi cities in different zones. Furthermore, its contribution to support the logistic aspects and vital role in supplying the GDP of Saudi Arabia as well as the future role to achieve the vision of 2030. The Jizan-Abha Highway extends for 180 km at the southern zone of Saudi Arabia between the Jizan and Asir zones. Particularly it extended between the longitude of 42º11 '41.77" E and the latitude of 17°38'7.75" N, and a lot of main valleys are intersecting with Jizan-Abha Highway that estimated as more than 25 main valleys.
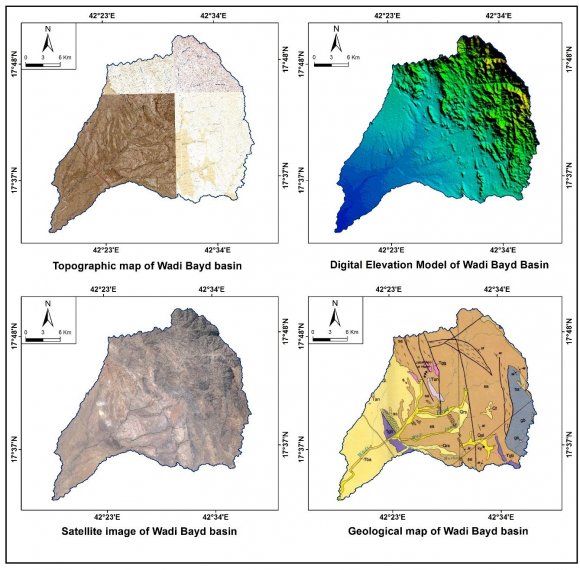
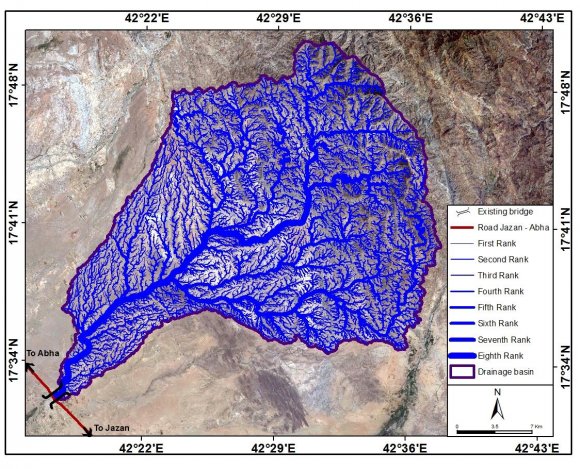
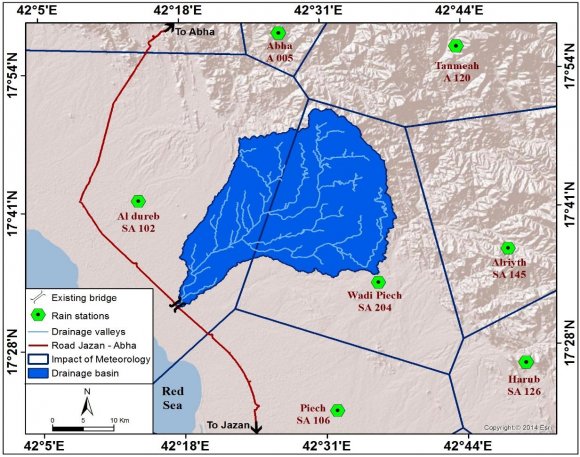
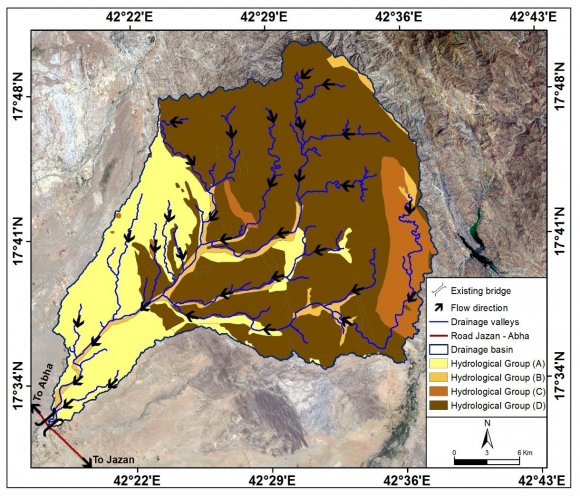
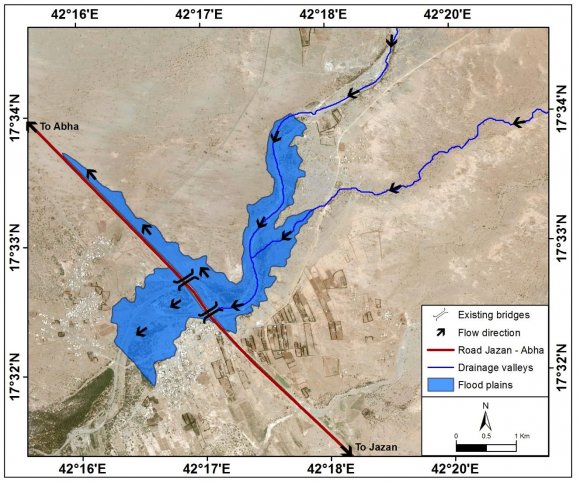
A model for the most frequently exposed areas was selected recently on the Jizan-Abha Highway, which is represented by the Wadi Al-Bayd watershed area. Wadi Al-Bayad watershed area, which affects the area of study, is located between latitudes 17°40''1.10' and 17°32"6.45' N, and longitudes of 42°37''45.86' E, and 42°17''22.58' E. the basin levels ranged between 705 meters and 781 meters. The valley ended at the level of 705 metesr above the sea level, and Wadi Al-Bayd is supplied by various secondary streams; El Hamda, Joan, Qalyta, Eldahra, Habab, and Batyeh. The basin extends with about 71.6 km, and an area of 704.81 Square kilometers as its slop reached 0.058 m/m, as shown in figures (1,2). Reasons for Selecting the Study Area and the Consequences of Flash Floods on the Jizan-abha Highway
The flood runoff flow of the Jizan streams presents one of the most important local environmental problems which impacting sustainable urban development. What makes this problem more seriousness is the high density of the valleys network that are more than 25 main valleys, which intersect directly with the international Jizan-Abha Highway such as; Wadi Khlab, Damd, Sebya, Besh, Aquod, Hily, Albatna, Segag, Ser, Bayd, Alaslab, Reem, Haswa, Tabab, Algarfah, Nakhab, Herman, and Albarakah. The flood runoff flow starts from the west to the east, which intersects with the international road. Set of factors are participated in repeated, and seriousness of those floods, as the most of important, is the occurrence suddenly and the unpredictability of their occurrence for the scarcity of monitoring stations.
Furthermore, the lack of early warning systems and poor distribution of the flood water facilities under Jizan-Abha Highway, and the inability of the majority to allow the flood runoff flow. Additionally, the unplanned and random expansion of the urban settlements, and other factors related to the shortage of detailed hydrological studies. The other associated factors are the absence of the engineering solutions for the upper streams of the valleys, as this came along with changing in the land use attributes during infrastructure development of the Jizan-Abha Highway path. Finally, the crowded density of draining network and it's severed slops that affecting Jizan-Abha Highway.
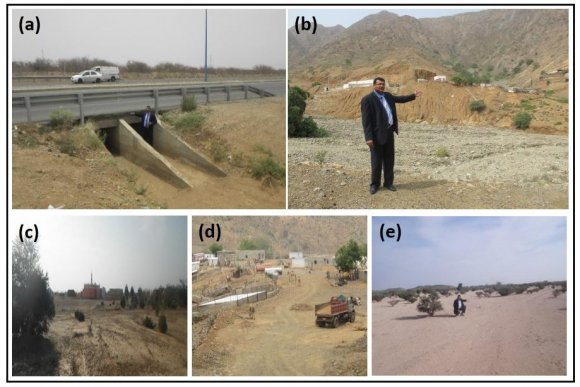
The site visit had conducted to verify the path of Jizan-Abha Highway during floods dated 15/4/1440 Hijri to determine the most impacted zones along the route. Moreover, the historical flood record was verified of the same area during interviews with local people and decision makers. The pervious verifications insure that the Wadi Al-Bayd, the current area of study, is the most affected dangerous area on the Jizan-Abha Highway for the frequency of collapses of infrastructure facilities. Especially this observation was after both Samrat Elged and Arequ Menshabah villages to drown during the recent floods. Those flash floods lead to loss lives, and damages of urban and infrastructure facilities as the highway in the study area, as well as hit vehicles and corrosion effects along the road. The Research Methodology and Data Processing
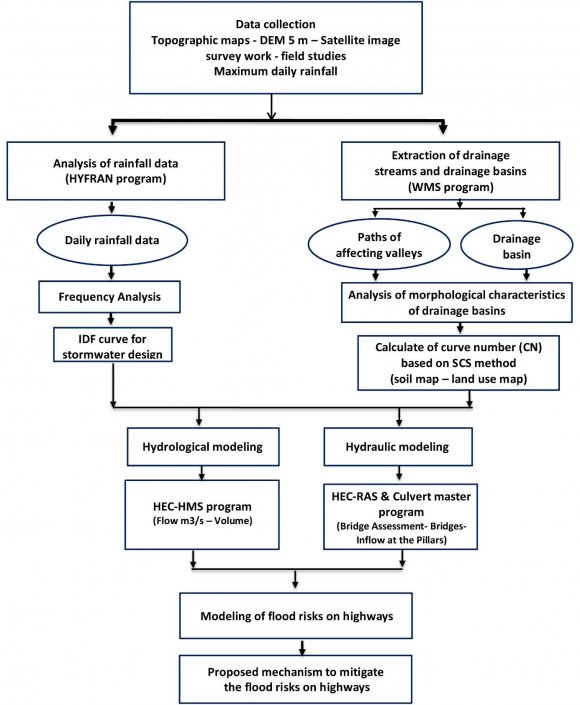
The determination and assessment for flood risk exposed areas are based on implement the HEC-RAS model for Jizan-Abha Highway. This for fixing the distribution, velocity, and the depth of the Wadi Al-Bayd flood runoff flow intersected with the international highway. That came along with the evaluation of the efficiency and abilities of the existing flood water drainage facilities as bridges and dry communication infrastructure below the Jizan-Abha Highway to allow the peak flow using Culvert master. A new approach had settled and suggested a proper mechanism to mitigate flood risks for infrastructure projects, particularly the existing and proposed roads. To achieve the study objectives, HEC-HMS of WMS was implemented to compute the floods hydrographs for different watersheds. The calculations of water quantities and inflow rates were based on SCS unit Hydrograph approach, as well as computing rainfall properties (rainfall depth) and IDF Curve for the watershed impacting Jizan-Abha Highway during the different referenced time using HYFRAN program. GIS and remote sensing also are used to produce different land use, soil, geological maps of the watershed that are the main inputs to run HEC-HMS/HEC-1 models. Culvert master again used to assess the efficiency of facilities as bridges and dry communication infrastructure and its abilities to deal with the runoff inflow, as well as HEC-RAS to determine the flood exposed areas. It was necessary to use mathematical equations that represented rainfall loss or that linked runoff to total rainfall. Kirpich's equation [31] was used to calculate the time of concentration (Table 1, Equation ( 1)), which is the time that passes between the rainfall and the highest level of floodwater going through the watershed area. Lag time, which is the time that passes between the occurrence of a unit of rainfall and a unit of runoff, was calculated according to Soil Conservation Service (SCS) guidance (Table 1, Equation ( 2)). To calculate the effective rainfall for each basin, it was necessary to use mathematical equations representing rainfall loss or linking runoff to total rainfall (Equations ( 3)-( 5), Table 1). The depth of rain or direct flood in the basin was calculated to derive the total quantity of floodwater from the actual rain value using Equation (3) (Table 1). The amount of water in the area before the occurrence of flooding, such as filtration and suspended rain on plants, was estimated using Equation (4) (Table 1), and Equation ( 2) could be simplified as shown in Equation ( 5) (Table 1). The maximum effort for soil moisture (Sr; maximum retention in cm) Was calculated from the curve number [32]. Peak discharge (m3/s) was calculated for each basin for different return periods using Equation ( 7) (Table 1), and the time to flood peak was calculated using Equation ( 8) (Table 1).
4. Table 1: Equations used in the current study
The used methodology data processed are illustrated in figure (4) in detailed through nine steps as follows; were also used on the scale of 1:50000, as well as geological maps, scaled 1:250000 to insure the streams path along with updated satellite images as Landsat 8/OLI sourced by USGS. The field visit played a vital role in determining the valleys and trails reefs in the study area, and the mathematical model (WMS) also supported to determine the drainage basins. Figure (5) shows the data used in the study sources.
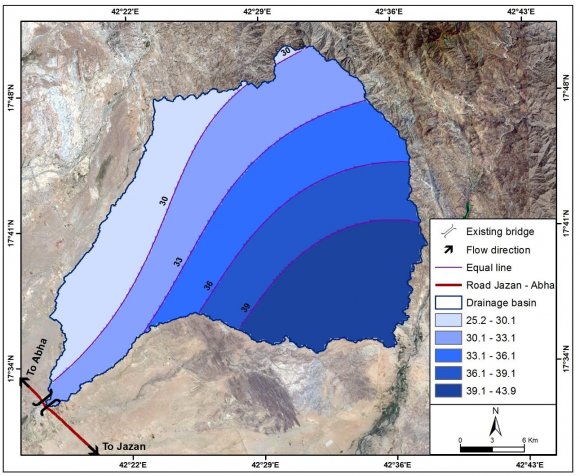
5. b) Precipitation Quantity Analysis of the Different Regression Periods and Determination of the IDF Curves
The accurate rainfall calculated amount in the basin is one of the important factors that helps to flood watershed computations [22]. It also considers as a correct principle for water statistics and the possibility of the floods recurrence. According to stations records of the Ministry of Water and Electricity, Presidency of Meteorology and Environment (PME) the study area has two stations that are Aldarb (SA102) and Wadi Beesh (SA204). The rainfall depth was concluded for different frequented times as (5,10,20,50,100, 2 years) using Hyfran [33]. Likewise different statistical patterns were adapted like Normal, Log-Normal, Log-Pearson Type III, Pearson Type III, Gumbel, Exponential, and this obtained that the (Exponential) is the best approach used by both Aldarb and Wadi Beesh monitoring stations as clarified in table (2) and figures (6,7,8). Watershed Modeling System (WMS) used to extract and digitize the streams and basins through the model of Drainage module from DEM menu, with is the main list of extracting and digitizing streams and basins by Compute flow direction/Accumulation. The system creates TOPAZ to determine the inflow directions and paths of valleys since the DEM is used with 5-meter accurate break. The outcomes compared by valleys paths of topographic maps scaled 1:50000 and the satellite images. As per observation, there is the main valley impacting the study area, it was Wadi Al-Bayd.
6. d) Morphological Characteristics
The extraction of the morphometric characteristics of the watershed is developed by Watershed Modeling System (WMS) model via Drainage module over computing basins data, since it computed automatically. Those characteristics are clarifying over the Display option, as there is a main basin impacting the study area, Wadi Al-Bayd. Wadi Al-Bayd has an area of 704.81 Km2, and a length of almost 71.6 Km with total slop of 0.0158m\m, as per table (3) and figures (9,10). 13), (14).
7. h) Determine the Land use
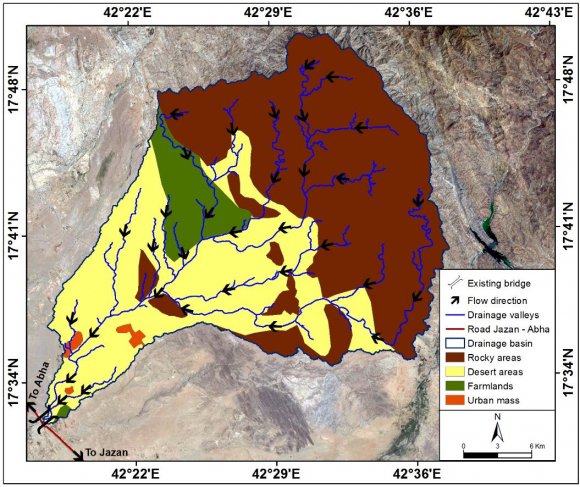
The land uses were extracted by using the satellite images of Landsat8/OLI over the Erdas Imagine program. The land use layer is processed in WMS by insert land use layer after identifying layers as "New coverage" through the GIS data, and then select "Add shape file data." There are four categories for using land use in Wadi Bayad basin such as; the first category is desert zones with an area estimated by 269.33 Km2, and the second category is presented by the urban zones that cover an area of 5.08 Km2 out of the Wadi Bayad total watershed area. While the third category shows the agriculture areas of 51.65 Km2, the fourth category presents the rocked zones with an area of 378.75 Km2, as shown in figure (15).
8. f) Rainfall Definition
The defining rainfall is one of the most important processes in WMS. There are several methods to define precipitation within the hydrological models provided by both HEC-1 and HEC-HMS. The most important is the Basin averages used in the case of knowing the rainfall amount/ quantities and insert them directly without calculating the weights of rainfall stations. This method does not take into account the effect of each station on the basins bodies. While the method of the Precipitation Gage Weight is used in case of small basin numbers and more than one station in the basin area, the Theissen Polygon polygons used to determine the effect of each station on basins. Nevertheless, the method of Stochastic modeling is used when large numbers of basins are existing. Figures (11,12) illustrates the hydrograph of different regression periods.
9. e) Extraction of concentration time and lag time
The WMS model obtained an enormous list of mathematical approaches to compute the time base and concentration time as most important morphometric parameters to compute the flood hydrograph. One of the prominent mathematical approaches in the WMS to compute concentration time is the Fort Bend county method, Kirpich method for overland flow on bare earth (mountains), ADOT method (Urban), Ramser method for channel flow. As well as it presents a vast list of mathematical approaches to computing the time base like Denver method, Tulsa rural method, SCS method, Riverside mountains method.
10. i) Computation of the Curve Number
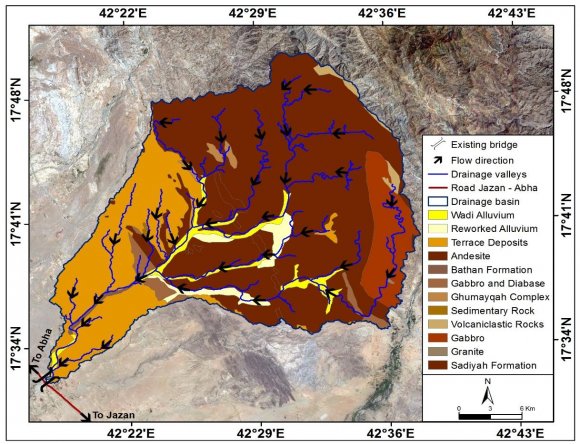
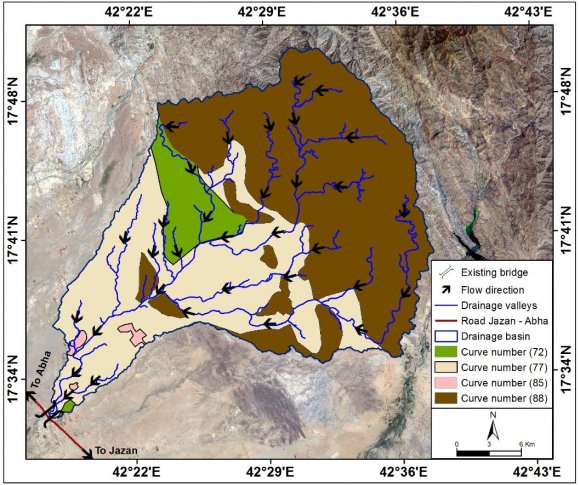
To compute the over precipitation quantity, it must use the mathematical rates that either shows rain losses or relates the runoff inflow and the total precipitation. The WMS provides many hydrological models such as HEC-1 and HEC-HMS, and each of them affords formulas to compute the losses and leakages. The most important methods within these models are Uniform Loss Method (LU), and Exponential Loss (LE), and Green & Ampt (LG) Method particularly the leakage in soil, Holtan (LH) Method, and the service management soil reservation for computing losses (SCS) loss Method. CN is the curve number method which is widely used to estimate water leakages in soil. CN based on three main factors, those are pre-condition of the soil moisture, land cover, and hydrological soil group, and its value is ranged between 0 and 100. Those factors are expressing the water response to the land cover component in watersheds, and also debriefing the surface hardness. Since values are indicating high numbers, to 100, that means the surfaces are less hardness, [34], as per figure (16).
11. Results
Any hydrological model such as HEC-HMS or another depends on a range of important inputs to calculate the flood hydrographs. The most important of these inputs are area and slope, concentration and base/delay time, CN values, and rainfall amounts. Accordingly, there are two methods for the HEC-HMS processing, as either through the program directly with the previous data preparation or preparing the mentioned data by the WMS program then transfers it to HEC-HMS. This was computed in the previous part of the study.
12. a) Compute the Flood Hydrograph of the Watersheds
HEC-HMS was implemented for its capabilities to compute the hydrographs in various methods due to both complicated and simple forms of the watersheds by artificial and normal methods [35]. WMS afford many hydrological models, as HEC-1 and HEC-HMS are considering as the most important models of them. Each of those models produces formulas to compute hydrographs. Accordingly, it must be realized, in case of selecting the hydrological model, that this will be related to the methods of computing the concentration period and base period/ delay time, losses, and hydrographs. For example; when select HEC-1 the program will provide fundamental methods are allowing computing hydrographs such as Clark (UC), Snyder (US), SCS dimensionless (UD), Given unit Hydrograph (UI), Kinematic wave (UK), and each of them affords hydrographs formulations.
13. b) Floods Volume Estimation
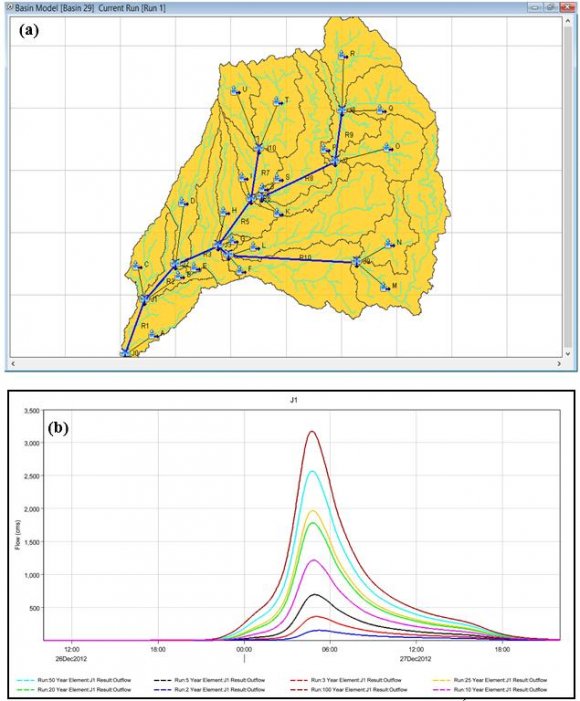
The hydrological model (HEC-HMS) was adapted using a designed storm with 24 Hr. duration with using the distribution of SCS TYPE II and SCS methods to calculate both delay and concentration periods. This was for different frequency periods of 10,20,50,100 years, and output results of the used hydrological model used to obtained flood hydrograph of the watersheds. It observed that the flood volume ranged between 14,354,700 -64,618,400 m3, as shown in table (4) and figure (17).
14. c) The Maximum Flood Inflow Estimation
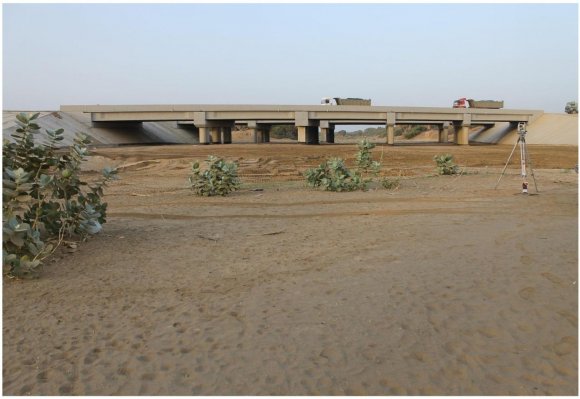
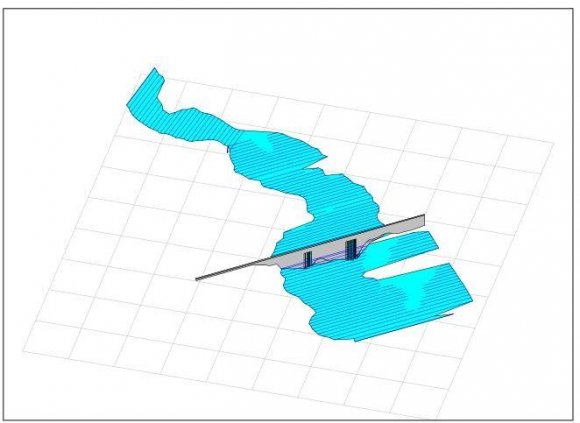
The values of the maximum flood inflow are varying for the basin affecting in the study area, and as per different precipitation volumes on each of the watershed areas. Accordingly, it obtained that the values of the peak floods inflow in the project location are ranged between 693.40 and 3,173.20 m3\S; as illustrated in Table (4) and figure (17). This phase is based on the modeling of the Wadi Bayid watershed inflow, and transforming it into a two-dimensional model showing the flood inflow As well as the velocity and depth of the flood runoff and this can only be done by using the hydraulic modeling of HEC-RAS to produce the floodplain. At this phase, the existing bridges under the Jizan-Abha Highway have evaluated that pass the maximum inflow of the Wadi Bayad basin using HEC-RAS, as shown in Figure (18).
The bridge study aims to determine its importance and ability to transfer and pass resulted inflows from the Wadi Bayad basin, which intersected by the Jizan-Abha Highway, figure (19). The Hydraulic model was developed using the HEC-RAS program to ensure that the bridge proposed engineering dimensions of the current case study is address.
Moreover, ensure that the bridge' designed criteria which required for the hydraulic design is proper to allow the inflow without causing damage to the highway structure or the adjacent areas. This program is capable of performing stable and non-Stabilized water runoff, as well as some hydraulic designs.
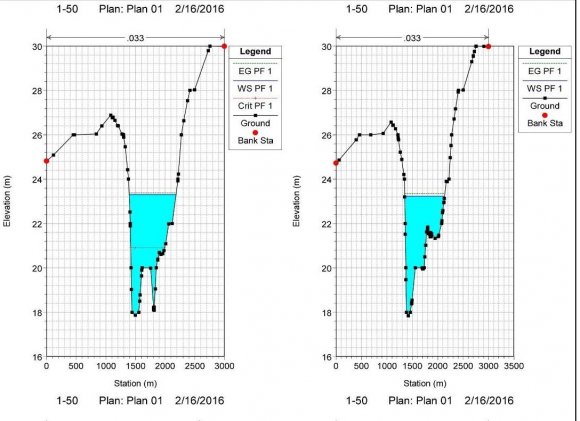
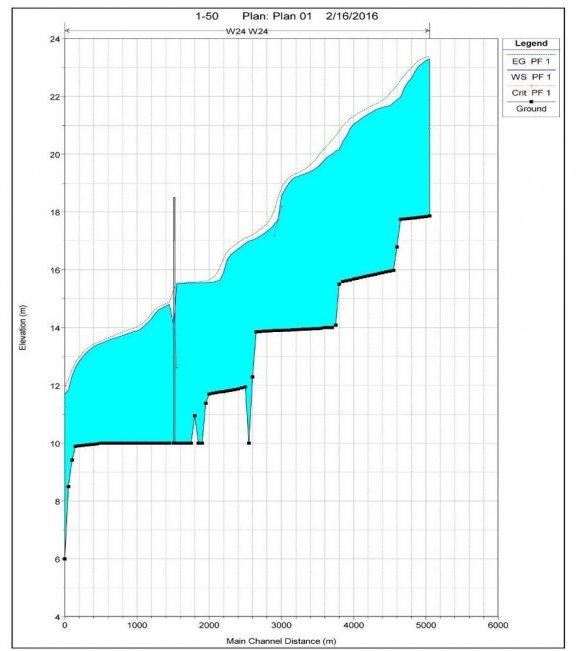
The developed of floodplain modeling of Wadi Bayad basin is based on insert the peak inflow as 3,173.20 m3\S during the strongest storm occurred during 100 years. As well as creating the cross-sections of the valley based on DEM. Figures (20), (21) show the samples of Cross-sections of the main valley of the Wadi Bayad basin.
15. e) Existing Bridge Assessment Using HEC-RAS
The bridges in the case study are used at the intersection of the valleys that are characterized by high inflows and a clear known Cross-section with the suggested pathways. Likewise, the study of the bridges aims to determine their importance and ability to transmit and pass inflows from the Wadi Bayad basin, which intersecting with the Jizan-Abha Highway. Also, the purpose of hydraulic analysis and bridge design is to identify the highest water surface level during the maximum flood runoff causing by the bridge, Figures (22), (23). As well as determine the water velocity before and after the bridge to dedicate the proper and required maintenance. Furthermore, its importance to determine the resulted erosion depth caused by the inflow at the pillars and supported walls. The hydraulic study of the bridges is based on the rainstorm repeated every 100 years.
Due to the Ministry of transportation in Saudi Arabia, it recommended addressing the proper vertical main bearing between water surface levels occurred during flood passing and the point of the minimum level on the bridge body. The aim of this main vertical bearing is to allow frequented floods to pass without damages in the bridge's body, as it mustn't be less than the minimum below the bridges than given values and criteria by the Ministry of transportation as shown in table (5) It was verified that the suggested engineering dimensions of the bridge are achieved the design criteria that must be met in the hydraulic design, which allow the inflow without causing damage to the Highway structure or neighboring areas. Table (6) shows the characteristics hydraulic analysis of the existing bridges to pass inflows of the Wadi Bayad.
16. Discussion a) Risks Map Analysis
Urban flooding has been and continues to be a major problem for many cities throughout the developed and developing world. The need to formulate a sound flood management policy driven by a knowledge of the frequency and magnitude of these floods is essential to improving the impacts of these floods. Flood risk maps can be used as an effective tool for water resources and urban planning by design engineers to assess the vulnerability of the infrastructure and residents of that area to flood events [36].
Flood risk mapping and hazard analysis for any watershed or drainage basin engage several factors or parameters and criteria [37,38]. Geographic information system (GIS) and remote sensing (RS) techniques have made significant contributions in natural hazard analysis [39,40], During the last few decades, researchers were involved in developing different methods and models for natural hazard mapping using RS and GIS techniques [41,42]. Frequency ratio [43,44], analytical hierarchy process [45], fuzzy logic [46], logistic regression [47], artificial neural networks [48][49][50] and weights-ofevidence [51], and multi-criteria decision support systems [52,53], Hydraulic modeling is a fundamental tool for managing and mitigating flood risk [22,[54][55][56][57][58][59].
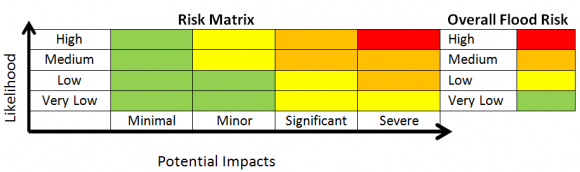
The first step to managing the flood exposed infrastructure is preparing an indicator as flood Hazard Index. Due to the survey through the literature reviews, the flood hazards modeling over the urban areas is present as one of the most widespread methods in the scientific, engineering communities. That flood hazards modeling depends on the hazard matrix, which relies on developing the 2D model that computes the flood velocity, depth, and water spread using a hydraulic model (HEC-RAS) to assess the flood hazard. It provides a 2D environment, which is vital in urban hazard modeling [60], The hazard matrix shows the spatial dimension of the expected floods in different scenarios that may present in both qualitative and quantitative approaches. The hazard assessment is to determine a certainly expected hazard, in a particular future period, as well as its effected area and impacts. This approach is more distinctive for it's appropriate to the urban areas. Water depth maps were developed as well as flood velocity and flood intensity level maps. Table (7) clarifies the hazard levels due to HEC-RAS the cross-section must be established and inserted to run this model, and the inflow rate in the valley starting point (m3/s) [61].
Using the Energy conservation equation, the computation of water depth and velocity is applicable [62], since various studies shown that this model obtained accurate and effective results in related floods studies [63,64]. Figure (24) illustrates the classifications of hazard affected human being using hazard assessment (HR), and table (8) shows the hazard classification map based on hazard assessment (HR) which depend on the water depth and velocity. The flood intensity is determined by a combination of depths and maximum flow velocities. It defined as the result obtained by the maximum depth and maximum velocity based on the CVFED [21]. As per HEC-RAS, the low-risk category (0.0-0.5 m3\S) dominating by share of 45%, and it forms about 2.7Km of Jizan-Abha Highway. While the high-risk zones (1.5 m3\S and more) a share of 35%, its area covers about 1.7 km of the Jizan-Abha Highway. About the middlerisk category, which ranged between (0.5-1.5 m3\S), it participated by 10% and, constitute about 1.2 km of the Jizan-Abha Highway. All of those mentioned areas of Jizan-Abha Highway are expected to be flooded by Wadi Bayad basin outflow, as shown in figure (25). The urban environmental management of the Saudi cities, as per Road jazan model, required Advanced applied technologies to confront flood hazards. Those technologies must be able to determine And test the quick affecting variables in the urban growth and changing of the land use. This will Contribute to understanding the flooded nature in those environments witnessed dynamic changes. Since both old maps and traditional instruments are disabled to support in developing effective and visibility, Adapted studies to face flood changes and urban growth. Therefore, this study came to discuss the implementation of the 2D model shows the flood water depth, spread, and velocity which based on Hydraulic modeling of (HEC-RAS) program in case of urban developing areas. The study also provides the 2D model of the flood water inflow spread, velocity, and depth, as those characteristics are not available in the flood water inflow one dimension model.
The conducted study clarifying that the Jizan-Abha Highway intersected by the main valley, which is Wadi Bayad basin, so it must be considered in design to increase the ability of the highway to face flood risks that it may, be exposed to The maximum inflow in the last 100 years was the main based input in this study. The floodplain and risk maps are helping in determine the exposed sites to the floods, as the inflow intensity could be known in any site of the highway to clarify the risk extreme at this site. Moreover, to understand the engineering solutions proposed properly.
According to this study, as it deals with a highway, it is important to keep it safe from the dangers of the floods or water erosion. Since the general erosion depth in the stream may be great, in this case, the obtained solution suggests protecting the highway sides by disconnected stones. Stones are placed on both highway sides to guard it, as the low-risk Cross-sections parts reaching about 3.2 Km. While the Cross-sections at moderate risk were about 1.3 km, the high-risk Crosssections of the highway was about 1.6 km.
The general erosion is calculated through the Lacey method, as well as the determination the diameter of the disconnected stones is necessary because it must be unmovable when floods are occurring belonging to 100 years. Since the stones must resist the shear forces caused by the inflow and velocity. The Isbach equation was used to calculate the diameter of the required diameter of the stones. Figure (26) and Table (9) are illustrating the proposed protection of the Jizan-Abha Highway.
17. D50: Mean diameter of riprap (mm)
: Empirical Coefficient ( =1.2) Yw: Specific gravity of water (Yw = 1.0 t/m3) Ys : Specific gravity of riprap stone (Ys = 2.65 t/m3) G: Gravitational acceleration (g= 9.81) V: Velocity of water (m/s) Jizan-Abha Highway Recently, geomatics of remote sensing (RS) and geographic information systems (GIS) have been employed as powerful and effective tools for determining land-use changes [65,66], In this study, four satellite images were downloaded every 10 years through the United States Geological Survey (USGS), to monitor the features of land-use change, The first in 1988, the second in 1998, and the third in 2013 of the TM sensor on the US satellite Landsat 4-5, While the fourth satellite images in 2019 from OLI sensor on the satellite Landsat 8, table (10), The classification process was conducted using the Maximum Likelihood method, The accuracy of the classification was done for satellite The proposed recommendations, due to this study, are giving priority to adapt to the flood risks protection plan and infrastructure for deification, which presents the Jizan-Abha Highway. As maintaining the existing water drainage facilities that found in the existing bridges with maintaining them continuously, with the importance of engineering penetrations to stop water erosion for about 4.3 km. Along with the need to maintain the highway from the erosions, the study is also prevents planning, developing, and land use works or usage inside or outside the urban development areas. The study also gives attention to the prime minister's dissension in 4/5/1428 Hijri which determine the procedures must take when facing flood risks, and admitted the hydrological studies, and technical design necessary before certifying urban and agriculture plans. The implementation of the hydraulic and hydrological models of WMS, HEC-HMS, and HEC-RAS is critical in the study of preventing the flood risks, and management infrastructure facilities, especially roads. The integration of these techniques with spatial modeling programs (GIS and RS) has proven to be very effective in identifying areas vulnerable to flooding and contributing to infrastructure management and risk mitigation.
is large and impacted. This study proposes to protect the highway sides by using disconnected stones with an action of stopped the urban expansion in the nearby villages towards Wadi Bayad basin.
This research may helps the decision makers in Jizan city and in many areas of the Saudi Arabia and the neighboring Arab countries to understand the flash flood impacts on the infrastructure such as roads. Since it provides an alternative solution can be studied and implemented to protect Roads from expected future floods.
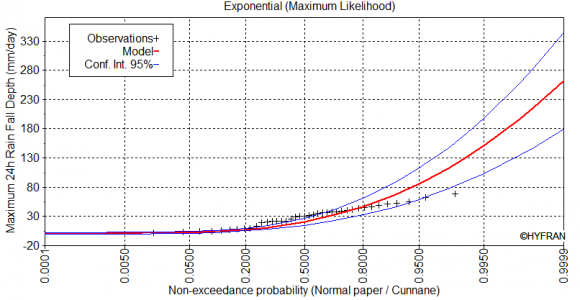
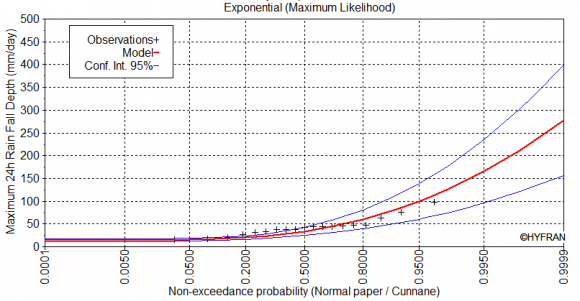


| Frequented Periods | 2 | 3 | 5 | 10 | 20 | 25 | 50 | 100 |
| Aldarb (SA102) | 20.9 | 32.3 | 46.7 | 66.3 | 85.9 | 92.2 | 112 | 131 |
| Wadi Beesh ( | 33.7 | 45.3 | 60.0 | 79.8 | 99.7 | 106 | 126 | 146 |
| Wadi Al-Bayd | 704.81 | 71597 | 0.0158 | 578 | 311.26 | 518.77 |
| The characteristics of flood water of the secondary watershed in different | |||||||
| Basin Name | Variables | frequented period | |||||
| 5 | 10 | 25 | 50 | 100 | |||
| Global Journal of Researches in Engineering | Wadi Bayad | Maximum discharge (m 3 \S) Flood volume (m 3 ) | 693.40 14,354,700 | 1,214.30 24,737,400 | 1,967.50 39,911,500 | 2,568.50 52,167,000 | 3,173.20 64,618,400 |
| Bridge Number | Water velocity (m\S) | Water level (m) | Inflow (m 3 \S) | Bridge dimensions Slot width Numbers of Slots (m) | Total width (m) | |
| 1 | 1.23 | 14.69 | 1,608.02 | 7 | 20 | 140 |
| 2 | 1.23 | 14.69 | 1,608.02 | |||