1. New Method for Static Load Test for Pile Rests in Sandy Soil Underlain by Clay
Rami Bakr Abstract There are many cases the use of shallow foundations doesn't fit for bearing capacity considerations. In some of these cases, there are soil layers with high strength properties that exist at shallow depths underlain by soil layers with less strength, and the continuous, suitable layer located at great depth. In these cases, it would be useful to use short piles rests on the functional shallower soil layers as bearing layer. These layers are either stiff clay layers with high shear strength or sand layers with high friction resistance or a mixture of both. Due to the presence of weak soils under the bearing layer, this research focuses on the behavior of pile that rests in sand underlain by clay soil. Two sites selected for this study, the first is located in Mansoura city while the other is in Gamasa, and both sites located in the Nile Delta Region of Egypt. In situ and laboratory tests were carried out to determine soil properties.
Static load tests conducted on several piles. Numerical simulation for the static load test then performed for each case. By comparing the results of both the static load tests and the numerical simulation of real-life loading, (RLL), the pile behavior described by the standard method of static load test, (SSLT), according to ASTM D-1143, is significantly exaggerated. This study proposes a new technique called Modified Quick Load Test (MQLT1.3). The proposed method is validated by numerical simulation and field static load tests.
Although the proposed process is less time-consuming, less expensive, it accurately represents the real pile behavior in the sand layer underlain by clay.
Résumé-Dans de nombreux cas, il existe des couches de sol avec des propriétés de haute résistance existent à de faibles profondeurs qui peuvent être utilisés comme portant des couches pour les pieux surtout quand il ya des couches de sable continue à de grandes profondeurs.
2. Introduction
he static load test has been regarded to be the most reliable test method because the actual pilesoil behavior directly obtained from the static load test. In delta regions, due to its lower level, the subsurface soil consists of successive layers of sand, clay and silt sediments. These deposits are usually built up from a mix of these soils. In many cases, thick sand or stiff clay layers exist underlain with other soft soils at relatively shallower depths. These soils are suitable as bearing layers for pile foundation with a careful study of the expected settlement. The authors proved that the pile behavior predicted by the current static load test method in clay soil is hugely exaggerated. The author proposed a new technique for the case of pile rests in clay based on numerical and field tests, Bakr, R., et al. 2103 and 2014. This study focuses on the evaluation of the standard static load test (SSLT) method as a tool for the prediction of the pile behavior when it rests in the sand layer underlain by clay. Field load tests and numerical simulation tools are used to evaluate the standard static load test.
3. II.
4. Test Sites
Two sites 50 km apart located in Egypt Nile Delta region were selected. The first site located in Mansoura city where 13 floors buildings constructed while the other site belongs to Delta University, which exists in Gamasa city on the Medetririan Sea south cost. Figure 1, Shows an image captured from Google earth for both sites. These sites were selected to represent the case of pile rests in sand layer underlain with clay. For site 1, the pile diameter is 0.5m, and its length is 14.5m. For site 2, three pile diameters are used 0.5, 0.6, and 0.8m with the same pile length 8.0m.
T
5. Soil Profile at Study Sites
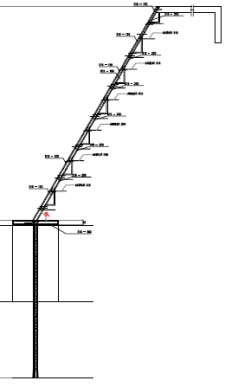
Two boreholes executed in the first site and fifteen boreholes performed in the second site. Figure 2 shows both borehole and static load test locations for site 2. Samples were collected from boreholes every meter, and necessary tests were carried out. The final water level found at depths 1.5 and 1.20 meter from the existing ground for sites 1 and 2 respectively. The soil at site-1 consists of the following layers:
1. From 0.0 to 1.0 m fill of dirty grey loamy clay followed by fill of dirty loamy sand from 1.0 to 2.0m. 2. Grey soft to medium clay exists at depth 2.0 to 6.0 m followed by dark grey very soft to soft silty clay from 6.0 to 8.0 m. 3. From 8.0 to 11.0 m dark grey fine silty sand, trace clay, and trace mica. 4. From 11.0 to 15.0 m grey medium/coarse sand, and trace silt. These are followed by grey medium/fine sand, with traces of silt from 15.0 to 18.0 m. 5. Grey soft to medium silty clay and little fine sand exists at depth 18.0 to 21.0 m followed by brown soft to medium silty clay from 21.0 to 23.0 m. 6. Soft brown sandy silty clay with traces of crushed cemented sand exists at depth 3.0 to 24.0 m. 7. From 24.0 to 25.0 m yellowish grey medium/fine sand with traces of silt.
The soil profile for site 2, shown in Figures 3. The main properties of soil for both sites as obtained from the lab and field tests for site-1 shown in Tables 1 through 3. Table 4 summarizes the soil properties for site 2.
6. IV. Estimation of Theoretical pile Bearing Capacity
The theoretical ultimate bearing capacity and the corresponding settlement contributions for each pile diameter were determined using the static formulas of the Egyptian Code of Practice for Deep Foundation, as shown in Table 2.
V.
7. Full-Scale Static Load Tests
According to (sslt)
No static load tests were conducted at site-1, while nine field static load tests conducted at site-2.
8. Numerical Simulation a) Introduction
Constitutive models are capable of predicting not only the onset of failure but also the complete stress-strain response leading up to failure. Three constitutive models used in this study; Mohre-Coulomb, Hardening Soil, and Soft Soil Creep.
Although the elastic-plastic Mohr-Coulomb model takes the increase of stiffness with depth into account, the Mohr-Coulomb model (MC) does neither include stress dependency nor stress-path dependency of stiffness or anisotropic stiffness.
The Hardening Soil model (HS) was developed based on the theory of plasticity instead of the theory of elasticity. This model includes soil dilatancy and a yield cap; therefore, it is far better than the original hyperbolic model by Duncan and Chang (1970). The hardening soil model includes two types of hardening; shear hardening and compression hardening. The main characteristics of this model as reported in literature are:stress dependent stiffness according to power law (defined by parameter, m), plastic straining due to primary deviatoric stress (defined by parameter, Eref50 ), plastic straining due to primary compression (defined by parameter, Erefoed), elastic unloading/reloading (specified by parameter, Erefur&ur
9. b) Numerical Simulation of Pile Static Load Test and
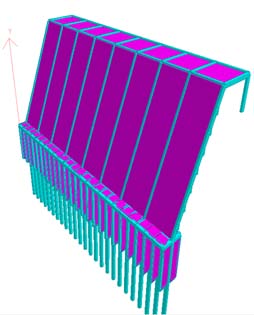
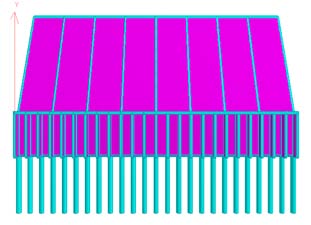
Real-Life Loading Numerical simulation was carried out of pile static load tests according to both standard method (SSLT) and Real-life Loading (RLL). Plaxis 3D Foundation used as a finite element software in the numerical analysis. The results of the numerical simulation of SSLT and RLL were compared with the results of the full-scale static load tests to evaluate the current method as a tool for the prediction of timedependent behavior of pile that rests in sand layer underlain by clay. MC, HS, and SSC models used in the evaluation of site-1. For site 2, From the analysis, the author noted that HS model gives a very exaggerated settlement concerning the full-scale tests; therefore, these cases excluded from the analysis. For site-2, MC was assigned to non-cohesive soil while SSC assigned to cohesive soil. As shown in Figures 4 through 6 and figures 7 through 9, the author noted that the results of both full-scale tests and numerical simulation of the standard static load test method are consistent. The author pointed out that the standard static load test method (SSLT) gives significantly exaggerated pile behavior for the case of pile rests in sand underlain by clay w. r. t. RLL.
10. c) Development of New Method for Pile Static Load
Test by Numerical Simulation (MQLT1.3) Numerical simulations for several loading scenarios were experienced to capture the pile behavior for the proposed load test that simulates its real behavior. Accordingly, a new method for the static load test called MQLT1.3 proposed as follows:
? Test load equals 1.30 times the design load. ? six equal load increments/decrements executed. ? Each increment/decrement equals 0.25 the design load except the last increment, which equals 0.05 the design load. ? The time periods for maintaining the load increments during loading stage are 0.5, 0.5, 1.0, 1.0, 1.0, and 2.0 hours and 0.25, 0.25, 0.25, 0.25, 0.25, and 2.0 hours for unloading decrements.
Numerical simulation was further conducted on the same cases of study, including both sites 1 and 2 but according to the new method MQLT1.3. Figures 10 to 12 portrays a comparison between the results obtained from numerical simulation for SSLT, RLL, and MQLT1.3 for the case of site 1 by MC, HS, and SSC, respectively. The results showed that the new method gives consistent pile behavior to that obtained from RLL. Seven field load tests were conducted at site 2, according to MQLT1.3, to validate the numerically developed static load test method. The diameters of tested piles are 0.50, 0.60, and 0.80 meters. The test piles were selected at different locations to represent the soil conditions in the whole site. Figures 13 to 15 show the load versus settlement relationships obtained from both numerical simulation and full-scale static load tests by MQLT1.3 for diameters 50, 60, and 80 cm, respectively. The author noted that the pile behavior predicted using the numerical simulation either for MQLT1.3 or RLL is more consistent with that obtained from the full-scale static load tests conducted according to the new method (MQLT1.3) concerning the standard static load test (SSLT). 6 presents a comparison between the theoretical pile capacity and the extrapolated. The author noted that the new method MQLT1.3 could predict the pile behavior accurately in sand underlain by clay. The working load determined from theoretical capacity by dividing by 2.0 on condition that this load includes the earthquake and other non-permanent loads. The working load defined from the load tests by dividing the extrapolated pile capacity by 1.5.
11. Global
IX.
12. Conclusions
From both numerical and field tests, the following conclusions extracted:
a) The new method called the modified quick load test method (MQLT1.3) accurately represents the real pile behavior. b) The numerical simulation using the MC model assigned to non-cohesive soil and SSC model appointed to soft soil accurately predict the pile behavior is bearing on sand layer underlain with clay. c) The standard static load test method (SSLT) gives a significantly exaggerated pile behavior for the case of pile rests in sand layer underlain with clay.
13. Analysis of test Results
By comparing the results obtained from both numerical analysis and field tests, the author noted that the pile behavior described as non-linear plastic. The total settlement occurred at the end of the loading phase by MQLT1.3 equals 0.95 to 1.05 times that
14. References références referencias


| Load, kN | Load, kN | |||||||||||||
| 0.00 | 0.00 | 500.00 | 1000.00 | 1500.00 | 0.00 | 0.00 | 500.00 | 1000.00 | 1500.00 | |||||
| 5.00 | Total pile capacity by M-C, RLL Total pile capacity by M-C, SSLT | 4.00 2.00 | Total pile capacity by SSC, RLL Total pile capacity by SSC, SSLT | |||||||||||
| Settlement, mm | 10.00 15.00 | Settlement, mm | 6.00 8.00 10.00 12.00 | |||||||||||
| 20.00 | 14.00 | |||||||||||||
| Year 2019 | 25.00 | 16.00 18.00 | ||||||||||||
| 4 | ||||||||||||||
| ( ) Volume XIx X Issue III V ersion I | Settlement, mm | 0.00 5.00 10.00 15.00 20.00 25.00 30.00 35.00 40.00 45.00 | 0.00 | 500.00 | Load, kN | 1000.00 | 1500.00 HS, RLL HS, SSLT | |||||||
| Global Journal of Researches in Engineering | ||||||||||||||
| © 2019 Global Journals | ||||||||||||||
| Load, kN | ||||
| 0.00 | 500.00 | 1000.00 | 1500.00 | |
| 0.00 | ||||
| 2.00 | ||||
| 4.00 | ||||
| Settlement, mm | 6.00 8.00 10.00 12.00 | |||
| 14.00 | ||||
| 16.00 | ||||
| 18.00 | ||||
| HS, MQLT_1.3_6_step | ||||
| HS, RLL | ||||
| HS, SSLT |
| Depth, m | WC% | GS | d | eo | sat | C, KN/m2 | ° | K*10-4 m/min |
| 3.00 | 35.18 | 2.70 | 17.17 | 1.088 | 17.81 | 34.00 | 19.10 | 0.0006 |
| 5.00 | 34.55 | 2.72 | 16.58 | 1.169 | 17.61 | 42.00 | 18.00 | 0.0004 |
| 7.00 | 70.60 | 2.71 | 15.21 | 1.976 | 15.43 | 6.00 | 4.90 | 0.008 |
| 18.00 | 27.84 | 2.73 | 17.85 | 0.917 | 18.66 | 19.00 | 16.80 | 0.0006 |
| 21.00 | 38.02 | 2.73 | 16.66 | 1.215 | 17.45 | 31.00 | 25.40 | 0.0006 |
| 23.00 | 36.88 | 2.73 | 18.34 | 0.995 | 18.29 | 9.00 | 3.70 | 0.008 |
| Depth | d | sat | compacted sandy soil | uncompacte d sandy soil | K, m/min | ||
| peak values | residual values | ||||||
| C, kN/m2 | ?? | C, kN/m2 | ?? | C kN/m2 | ?? | ||
| 8.00 | 16.58 | 16.58 | 6.00 42.90 0.00 | 38.00 | 0.00 | 36.70 0.0006 | |
| 15.00 | 18.15 | 18.15 | 0.00 47.00 0.00 | 37.80 | 0.00 | 36.10 0.0137 | |
| 24.00 | 17.66 | 17.66 | 0.00 43.50 0.00 | 37.50 | 0.00 | 35.00 0.0101 | |
| VIII. | ||||||||
| Depth | kN/m3 | Wc? % | e? | Cc loading | Cs unloadi ng | Cv cm2/min | mv m2/kN | Pp kN/m2 |
| 2.00 | 18.62 | 22.11 | 0.738 | 0.14127 | 0.02630 | 0.027 | 0.0002 | 101.00 |
| 6.00 | 16.78 | 33.33 | 1.123 | 0.50155 | 0.04010 | 0.009 | 0.0006 | 173.00 |
| 19.00 | 18.25 | 27.34 | 0.868 | 0.28247 | 0.05300 | 0.009 | 0.0003 | 203.00 |
| 22.00 | 17.27 | 37.62 | 1.125 | 0.60649 | 0.04040 | 0.026 | 0.0007 | 213.00 |
| Sit e | Pile Dia. m | Qb kN | Qf kN | Qu kN | Qw kN | Qt kN | Ss mm | Spp mm | Sps mm | St mm |
| 1 | 0.50 | 642 | 975 | 1617 | 808 | 1212 | 2.09 | 23.55 | 1.18 | 26.82 |
| 2 | 0.50 | 389 | 158 | 500 250 | 375 | 0.56 | 7.85 | 0.15 | 8.55 | |
| 0.60 | 560 | 189 | 600 | 300 | 450 | 0.53 | 9.42 | 0.16 | 10.11 | |
| 0.80 | 719 | 281 | 1000 | 500 | 750 | 0.31 | 24.58 | 1.63 | 26.52 | |
| Pile Dia. | Test # | Quth | Qwth | Qt | St | Sp | Quex | Qwf | Qwf/QWth |
| cm | kN | kN | kN | mm | mm | kN | kN | % | |
| 50 | T-10 | 500 | 250.00 | 325 | 4.22 | 1.56 | 420.11 | 280.07 | 112.03 |
| T-11 | 4.32 | 1.73 | 507.34 | 338.23 | 112.74 | ||||
| 60 | T-14 T15 | 600 | 300.00 | 390 | 4.53 4.15 | 1.64 2.72 | 487.48 533.91 | 324.99 355.94 | 108.33 118.65 |
| T-12 | 5.47 | 2.55 | 767.00 | 511.33 | 102.27 | ||||
| 80 | T-13 | 1000 | 500.00 | 650 | 5.45 | 2.43 | 820.80 | 547.20 | 109.44 |
| T-16 | 5.61 | 3.46 | 867.50 | 578.33 | 115.67 | ||||
| Where; Quth = ultimate theoritical pile capacity, Qwth = working load from theoritical pile capacity, Qt = test load, Sp = plastic | |||||||||
| settlement, Quex = ultimate pile capacity from extrapolating, Qwf = working load from field test. | |||||||||
| 1. Adachi, T., Oka, F., 1982. "Constitutive Equation for | |||||||||
| Normally Consolidated Clays Based on Elasto- | |||||||||
| Viscoplasticity," Soils and Foundations, Vol. 22, | |||||||||
| No.4, pp. 57-70. | |||||||||
| 2. | |||||||||
| DEPT H, M | d | sat | wc | C | °eo | Cc | Cs | Cv | Nc | Dr | ||
| 0.00-5.00 | 14.50 18.00 25 -85 | 0.0 | 3 -41 1.33 -2.05 | N.A | N.A | N.A | 6 -44 | 80 | ||||
| 2 | 5.00-7.00 | 10. 20 13.60 49 -89 | 9 -12 3 -8 | 1.16 -1.50 | 0.54-0.91 | 0.075-0.086 | 0.013-0.035 | 9-35 | N.A | |||
| 7.00-12.00 | 16.30 16.80 21 -25 | 7 -10 32 | 1.10-1.30 | N.A | N.A | N.A | 20 -58 | 80 | ||||
| 12. 00-21.00 | 15.20 16.30 26 -50 | 8 -22 5 -22 1.06 -1.75 | 0.51-0.68 | 0.048-0.082 | 0.018-0.024 | 31 -47 | N.A | |||||
| 21. 00- | 13.30 17.95 32 | 0.0 | 39 | 1.10 | N.A | N.A | N.A | 15 - | 80 | |||