1.
lobal temperature changes have become a major problem in global warming in recent years. In addition to energy demand, there is also an environmental threats. Many countries are concerned to reduce their ozone-damaging emissions and to continue their efforts to improve the energy system. Renewable energy sources see how these problems are solved. In 2017, an estimated 17 countries generated more than 90% of their electricity from renewable sources [1]. Solar energy is considered to be one of the most important renewable sources available in abundance, free of pollution and free of charge in remote areas where there is still no electricity. [2]- [3].
Solar power extracted from solar photovoltaic (PV) cells delivers low efficiency [4]. Because of these problems, it is important to extract maximum power from solar photovoltaic cells and improve efficiency in different weather and temperature conditions. An MPPT or Maximum Power Point Tracking is an electronic tracking device usually digital DC to DC converter which is connected between solar panels and battery or the utility grid that optimizes the match between the solar array (PV panels), and the battery bank or utility grid. It monitors the PV array for the maximum power point and tries to use this information not only to control the output Typically, this means that the voltage is reduced while the current is increased and most of the overall output power is maintained. In this research with the MPPT controller, we used P&O algorithm that has a conversion efficiency of 95%. Output gain varies greatly due to partial shading, bad weather condition, temperature effect, battery charging state, and other consideration.
2. METHODOLOGY OF PV SYSTEM
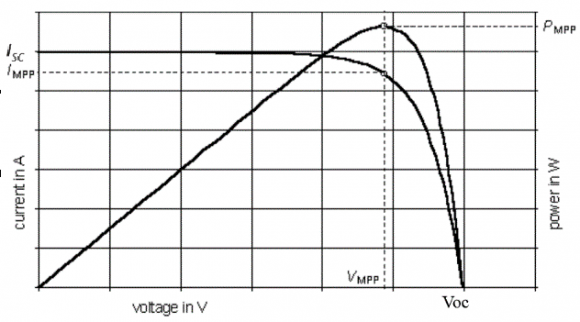
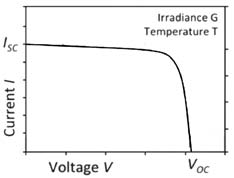
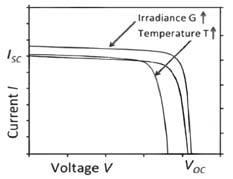
A typical MPPT and PV system consists of photovoltaic array modules. The designing ideas first come from the Photovoltaic cell (PV cell) or solar cell which can absorblight from the sun and that transmitted to the absorber layer and converted into electrical energy, the process known as the photoelectric effect. An electrical circuit that contains only a currentsource (?? ?? ) and a diode (D)can represent an ideal solar cell. In real life, however, there is no ideal solar cell so that with the proposed model there is series and shunt resistance (?? ?? , ?? ???? ) added. IV-curve which is represents the performance of a solar cell demonstrated by measuring its current and voltage employed on the device and defined for a unique set of temperature and irradiance conditions. For example, if the irradiance (G) increases, the IV curve improves, but the temperature (T) increase leads to a worse IV curve and vice versa [5].
3. Global
There are three important points:
4. b) Characteristic Equation of PV Cell
The current (I) generated by the solar cell from the equivalent circuit,
?? = ?? ?? ? ?? ?? ? ?? ???? (1)The diode current is controlled by the voltage,
?? ?? = ?? + ???? ??(2)The current through the diode is diverted by the equation of the Shockley diode:
?? ?? = ?? 0 ?exp ? ?? ?? ???? ?? ? ? 1?(3)In accordance with Ohm's law, the current of shunt resistor(?? ???? ):
?? ???? = ?? ?? ?? ????(4)The characteristic equation of a solar cell by replacing them with equation ( 1):
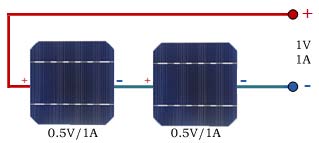
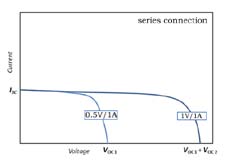
?? = ?? ?? ? ?? 0 ?exp ? ?? + ???? ?? ???? ?? ? ? 1? ? ?? + ???? ?? ?? ????Where, A single solar cell cannot deliver the necessary output. The required number of such cells is therefore combined and forms a photovoltaic module or solar module [4]. Connecting cells in serial circuits, the total circuit current remains the same, but the output voltage increases and the output current increases in parallel, but the voltage remains the same.
??5. d) Photovoltaic Array
A group of PV panels is connected to a large array in series and parallel known as Photovoltaic Array [4]. For higher voltage requirement photovoltaic panel are wired in series but for higher current wired in parallel. The Photovoltaic array VI-characteristic equation can be expressed as,
I = N p × I L ? N p × I 0 ?exp ? V + I × ? N s N p ? × R S N s × n × V T ? ? 1? ? V + I × ? N s N p ? × R S ? N s N p ? × R SHWhere,
6. ?? ?? Number of PV modules connected in series ?? ?? Number of PV modules connected in parallel
The output voltage of the array:
V out = ((12V | 12V) || (12V | 12V)) = (24V || 24V) = 24VThe output current (I T ) is equal to the total of the parallel branch currents:
I T = (3.75A | 3.75A) || (3.75A | 3.75A) = (3.75A ||3.75A) = 7.5AThe maximum power of the PV array can be calculated as:
P out = V out × I T = 24 × 7.5 = 180??The maximum output of 180 watts in full sun. The actual output is usually much lower than the calculated 180 watts due to different radiation level, temperature effect, electrical losses, and other factors.
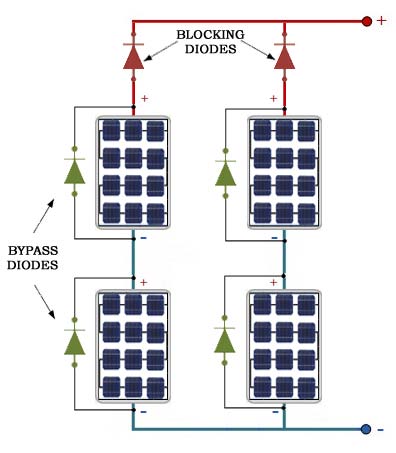
Due to shading and reverse current flow excessive heat and power loss occurs in the PV system. To prevent heat and power losses there two types of diode diodes are used, Bypass diodes and Blocking diode. The same type of diode, Schottky barrier diode is used for both but what's makes it different is, how it can be wired and what it does.
Bypass diodes reduce power loss due to shading effect [5] (caused by dust, leaves, trees, buildings etc.) in solar panel and may generate excessive heat. The diode is wired parallel to the cells so that current can flow through the diode even the cell not operate or damage.
During night time there is a high possibility to discharge battery due to reverse current flow from the battery into the solar panel because of lower solar panel voltage. The series blocking diode prevents reverse flow and only allows the power to enter the battery and prevent from being discharged.
7. III. Implement & Design of Step-Up/Boost Converter
A fundamental DC-DC boost converter (step-up converter) arranged that step-up the input voltage so that the output (load) is higher than the input [6]. We can control DC output voltage by controlling the percentage of time that turning the switch on and off.
ii. Switch off (0% duty cycle)
If we leave the switch turn off 100% of the time, the output voltage will equal to the battery voltage.
8. Switch on (100% duty cycle)
If we leave the switch always on 100% of the time, the current will theoretically keep increasing to infinity and overcurrent flow can generate an excess amount of heat which can cause damage the entire circuit.
9. b) Simulation Model of Boost Converter
The SIMULINK and MATLAB model shown in Fig. 14 represents a DC voltage source connected to a resistive load through a DC-DC boost converter with an IGBT (switching device), where the duty cycle is manually updated to attain maximum power. Using
Pulse Generator here we are controlling duty cycle. Duty cycle is the ratio or percentage of the period of time for which the switch is activated.
Parameters of DC-DC boost converter as given in Table 1. The performance of the boost converter circuit without PV module conditions as given in Table 2& Table 3.
When a 6V and 10V DC voltage source connected, at 53% duty cycle efficiency shows a maximum 96% and at 52% duty cycle efficiency from the boost converter is 97.5%.Irradiance and temperature effect neglected in both cases.
10. Principle and Research of the Mppt
The Maximum power point tracking, MPPT charge controller examine the output power of the PV panel and compare it with battery voltage then maximizes the output in all different conditions [8]. The output gain varies considerably due to partial shading, bad weather, temperature, battery charging and other factors [8]- [9]. The SunPower SPR-305-WHT is rated at 5.58 amps at 54.7 volts.
The maximum power can, therefore, be extracted from the PV panel, (54. A range of methods for tracking the maximum power point (MPPT) was proposed [10]. Among different MPPT algorithms, a detailed study of the P&O algorithm and its comparison of the advantages, deficiencies, and efficiency has been shown.
11. a) MPPT-Perturb and Observe (P&O) Method
The operating point of the MPPT is not constant, so the algorithm struggles with rapidly changing climatic conditions that have a serious effect on the efficiency of the algorithms [12]. The P&O algorithm flowchart is shown in Fig. 16.
?? ???? = ?? ???? × ?? ?? (W) Output Voltage (?? ???? ) ?? ?? (A) ?? ?????? = ?? ???? ×?? ?? (W) ? = ?? ?????? ?? ????(Perturb and Observe (P&O) method provides perturbation of the PV module or array voltage. This would mean an increase in power or a decrease. If the operating point is to the left of the maximum power point and therefore further voltage perturbation to the right is required to reach the maximum power point [11]. Conversely, if the voltage increase leads to a decrease in power, the current operating point is to the right of the maximum power point and further perturbation of the left voltage is necessary to reach the maximum power point. The algorithm thus converges over the various perturbation to the maximum power point. Table 6. Showing the efficiency of the output power varies when the simulation runs at the same irradiance level without the MPPT controller. For a solar irradiation value of 1000W/m2, the power from a load of 289.6 watts greater than the output value of ?? ???? without a MPPT PV system. Similarly, it shows maximum output with MPPT controller at different irradiation levels.
12. Global
V.
13. Conclusions
This paper presents perturbation and observation method which implemented with the PV module and MPPT controller, which works at rapidly changing irradiation levels, temperature effect and partially shaded solar panel. PV system and Simulation of PV Model analyzed using MATLAB/SIMULINK. In addition, this is important that the efficiency of the algorithm had to be as high as possible, and the MPPT had to have an efficiency of at least (93-95) %.It has tested and verified that the MPPT controller and the algorithms implemented with it works properly. After implementing MPPT with Boost Converter, the controller can select the maximum power point and efficiency for rapidly changing irradiance levels, temperature effect and partial shading of the solar panels. In addition, result shows that MPPT P&O method increased and gives at least 95% efficiency.
![?? Reverse saturation current of the diode ?? ?? Series resistance of a solar cell ?? ???? Parallel resistance of a solar cell ?? ð?"ð?" Thermal voltage,V T = kT q , [at 25°C, V T approx. 0.0259] T Junction temperature in Kelvin (K) K Boltzmann constant (1.38 × 10 ?23 J/K) Q Electron charge (1.6 × 10 ?19 C) N Diode ideality factor (1 for the ideal diode) c) Photovoltaic Module](https://engineeringresearch.org/index.php/GJRE/article/download/1907/version/100992/1-MPPT-Charge-Controller-Design_html/21690/image-5.png)
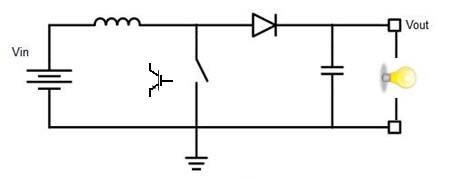
![Fig.9.Boost converter circuit containing an inductor, a transistor, a diode, and a capacitor. The connection of the transistor behaves similarly to a switch which can turn on or off by controlling transistor gate voltage. If we close the switch DCvoltage appears across the inductor and continue increasing so long as the switch is closed. The current through an inductor cannot change instantaneously [7] therefore the moment we open the switch the inductor will create a force causing the current to continue flowing towards output circuit.](https://engineeringresearch.org/index.php/GJRE/article/download/1907/version/100992/1-MPPT-Charge-Controller-Design_html/21692/image-7.png)
| S. No. | Name of the Parameter | Values |
| 1 | Load Resistance (R) | 50 ? |
| 2 | Inductor(L) | 10 Mh |
| 3 | Frequency | 10 kHz |
| 4 | Capacitor (C) | 1000 ?F |
| 5 | No of Diode | 1 |
| 6 | No of Switch (IGBT) | 1 |
| 7 | Pulse Generator | 1 |
| 305-WHT) | ||
| S. No. | Name of the Parameter | Values |
| 1 | Open Circuit Voltage (Voc) | 64.2 V |
| 2 | Short-circuit Current (Isc) | 5.96 A |
| 3 | PV Panel Max. Power | 305 W |
| characteristics | ||
| 4 | Maximum Power Voltage (Vmp) | 54.7 V |
| 5 | Maximum Power Current (Imp) | 5.58 A |
| 6 | No of cell per module | 96 |
| 7 | No of series-connected module | 1 |
| 8 | No of parallel string | 1 |
| 9 | Temperature (T) | 25ºC |
| irradiance level | |||||||
| ???? (W/m 2 ) | ?? ???? (V) | ?? ???? (A) | ?? ???? (W) | = | ? ?? ?????? ?? ?????? | % | %D |
| 35.58 0.71 | 25.26 | 8.3 | 47.6 | ||||
| 114.1 2.28 260.15 | 85.3 | 50.6 | |||||
| 1000 | 118 | 2.36 278.48 | 91.3 | 54.8 | |||
| 119 | 2.38 283.22 | 93.8 | 56.5 | ||||
| 120 | 2.41 | 289.6 | 94.9 | 56.9 | |||