1. Introduction
he impact of urbanization is the important concern that significantly alters the catchment hydrology such as increase in peak flow, runoff volume and decreases the infiltration rate, runoff retention time and base flow. The quality of urban runoff in terms of the amount and types of pollutants generated and transported varies depending on land usage, and the activities carried out on the land (Arnold et al., 1996). Urban runoff quality and pollutants loading have been shown to have a high variability among different land use such as residential, industrial, commercial, agricultural, and land for the recreational purpose (Egodawatta et al., 2007). Rajshahi is one of the developing cities in Bangladesh and characterized by rapid urbanization. Large tracts of land are converted to residential, commercial and industrial developments (RCC Website, 2018). The study primarily concentrated to investigate the impact of land use characteristics on the variability of urban stormwater quality in Rajshahi City.
2. II. Study Areas and Sample Collection
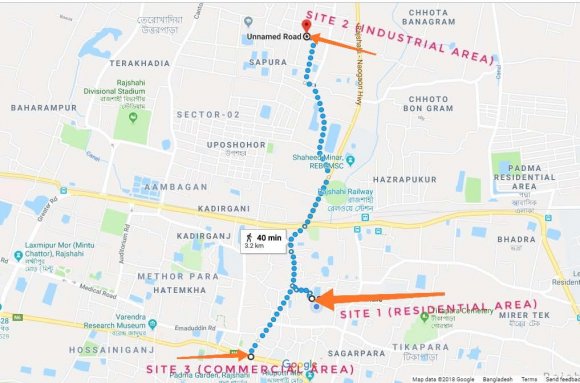
Rajshahi is the 4 th largest among the eight divisions in Bangladesh that covered the area of 18,153.08 sq. Km (RCC Website, 2018). The study areas were selected at three different land uses such as residential, commercial and industrial in Rajshahi City Corporation as shown in Figure 1. The storm water sample was collected from three roads surface runoff such as Aloker Mor, New Market (site 1-residential), Bscic, Sapura (site 2-industrial) and Zero Point, Shaheb Bazar (site 3-commercial) in Rajshahi City (Figure 1). The details characteristics of these study areas are discussed below.
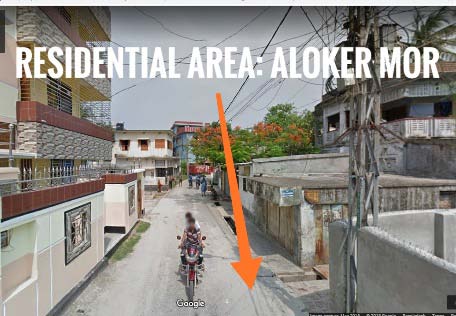
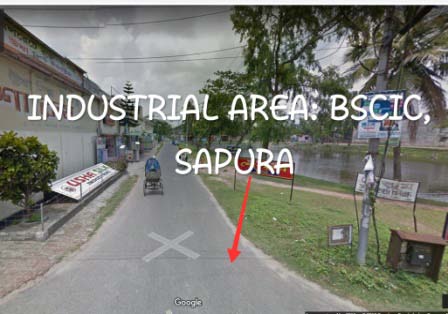
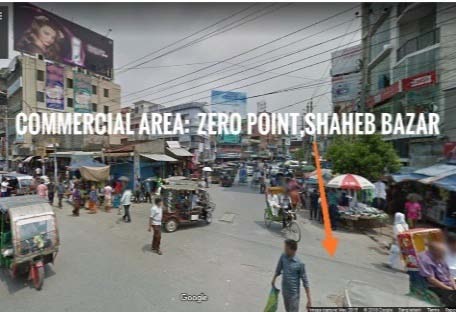
Site 1: Aloker Mor, New Market is an access road located in a typical suburban residential area with detached family houses (Figure 1a). The reason for choosing this site is typical urban form and road pattern. Most of the arterial roads are used by residents for convenient access. The pollutant availability on the road surface primarily depends on the periodic cleaning by street sweepers and light traffic. Site 2: Even though Rajshahi has very limited industry so Bscic is one of the well known industries and situated in Sapura. Though Bscic industry is located along the road hence the site is selected as industrial area. A number of loading and unloading tasks is occurring everyday by heavy vehicle. Hence, the selected road surface was found highly eroded (Figure 1b). Site 3: Zero Point, Shaheb Bazar is a crowded market area and is considered to be one of the busiest commercial areas in Rajshahi (Figure 1c). The traffic density is very high compared to other sites. The road surface condition of the place was found to be fair but with a coarse texture.
The sample collection was undertaken based on the standard procedure recommended by EPA, 1992. Sample was collected three times from one location at different rainfall events to understand the effect of dry periods on the variability of stormwater quality. After sample collection, the bottle was properly sealed and leveled for future identification.
3. Methodology
The collected samples were tested in the laboratory to determine the physical and chemical parameters using standard quality control and test methods specified in APHA 1999. The physical parameters include temperature, pH, turbidity, EC where chemical parameters are total suspended solids (SS), BOD. To investigate the relationship between land use characteristics and water quality, univariate techniques such as mean, median, standard deviation were applied.
4. a) Sample testing
The physical parameters such as temperature, pH, turbidity, EC were tested instant after collecting the sample. Then the chemical parameters were tested within 24 hours of collection. The sample testing was undertaken at the Environmental Engineering laboratory of Rajshahi University of Engineering and Technology. Standard quality control and test methods specified by APHA were followed to conduct the laboratory test (APHA, 1999).
5. b) Univariate and multivariate analysis tools Mean:
The mean can be defined as the average of a numbers in a data set. Mean can be calculated from the ratio of the sum of data values to the total number of data points. The mathematical expression of the mean is shown in Equation (1).
?? ? = ? ?? ?? ?? (1)Here, ? ?? ?? = sum of data values.
N = total number of data points.
6. ?? ? = mean
7. Standard deviation (SD):
Standard deviation (SD) can be defined as the calculation of dispersion of a data set from its mean. SD also measures the variation in the distribution of a data set. This indicates that if the SD value is higher, the Global Journal of Researches in Engineering ( ) Volume XIx X Issue I Version I variability or dispersion is higher and the deviation of the data point from its mean is also higher. The mathematical expression of the SD is shown in Equation (2).
SD, ?? = ? ?(????? ?) 2 ???1 (2)Here, x= individual data points ?? ? =mean/average of the data points N = total number of data points ??= standard deviation
The coefficient of variation (CV):
The coefficient of variation (CV) can be defined as the ratio of the SD to the mean. If the CV value is higher, the dispersion level of the data points around the mean is higher. The CV is usually expressed as a percentage. An estimate can be considered more appropriate if the CV becomes lower. The mathematical expression of the CV is shown in Equation (3).
8. Results and Discussions
Table 1 shows a summary of the analysis results for selected stormwater quality parameters for each land use category. It can be seen that pollutants concentration vary considerably for each land use, which indicates that pollutant distribution throughout the catchment is highly dependent on land use. Suspended solids are one of the main indicators of water quality. Most of the pollutants absorbed by suspended solids and transport by storm water runoff (Ranjan and Shane, 2011).
Storm water in residential area demonstrated the cleanest appearing storm water with the lowest average amounts of suspended solids within the storm water. With a small variance for suspended solids and turbidity, residential sites are comparative clear among the other selected study areas.
The storm water quality in the industrial area was found highly polluted than other land use. This variation is due to the presence of the highest amounts of suspended solids and turbidity in the storm water runoff compared to the other land use. The industrial location also recorded a higher BOD value than the residential sites. This variation is due to the presence of organic matter in industrial waste and distributed by traffic and wind. The average concentrations of pH, Turbidity, Conductivity, SS, BOD in each land use area and the EPA standard guideline value for storm water are shown in Table 2. Table 2 shows that the highest pH value was found 6.90 in residential area, lowest is 6.42 at the industrial site which complies with the EPA guidelines as 5.5-8.5 for storm water. The EC, turbidity, suspended solids was found highest in the industrial area which is also an acceptable level of EPA guidelines (Table 2). Study result shows the highest BOD value of 8.23 in the commercial area is also an acceptable limit of less than 20 mg/L recommended by EPA.
The average pollutant concentrations for three different land uses are shown in Figure 1 Commercial storm water resulted in containing low concentrations of suspended solids and turbidity value than industrial sites. However, the highest BOD value is recorded in commercial area than other sites. This is because commercial area produces the highest organic wastes that decomposed on road surfaces and wash-off by storm water runoff. 3. When the very fine solid particles remains suspended in water then turbidity are formedthat further prevents the light penetration and unbalance the aquatic ecosystem. As seen in Figure 3, the highest turbidity was found in the industrial area. This can be due to the presence of fine particles from different production processes and distributed on the The variation of EC is shown in Figure 1. As seen in Figure 1, industrial area has a higher EC than others. This variation can be due to the reaction of chemical or metal substances with the water flowing from the runoff area. Residential area has a lower value compared to others because there is no reaction of chemical or metal substances.
As shown in Figure 2, pH value was found similar for both industrial and commercial areas. This variation can be due to the presence of chemical and metal that reacts with water and decrease the pH value.
In contrast, higher pH was found for the residential area due to the decomposition of organic substances such as plant leaves, vegetation, etc. Variation of BOD value is shown in Figure 5. As seen in Figure 5, the residential area has a lower BOD compared to industrial and commercial areas. As we know, BOD value measures the amount of dissolve oxygen to biologically decompose organic matters. The presence of organic matter is higher in the commercial area that produces from local fruit seller, decomposed fruit bunch and vegetable waste. In contrast, residential area produces a small amount of organic waste that's why the value is lowest among the others.
9. Global
10. V. Conclusions
To understand the impacts of land use pattern on storm water quality, storm water samples have been tested in three land use areas; residential, commercial, industrial lands in Rajshahi city. The results show very interesting patterns. Turbidity value was found comparatively higher in the industrial area than other land use. Excessive use of chemical, industrial production, heavy use of machine increases the value of water quality parameters such as turbidity, EC in industrial area. The highest BOD value was recorded in the commercial land. The industrial storm water had the dirtiest appearing storm water quality showing the highest amounts of suspended solids. Residential storm water shows the lowest concentrations of pollutants with higher pH value.
The study results will provide a clear idea about storm water pollutants generating from commercial, industrial and residential areas. Also this study will guide to the storm water management authority for development of natural treatment systems for treating the stormwater pollutants for specific land uses to safeguard the receiving water quality and aquatic ecosystem. The variation of suspended solids (SS) is shown in Figure 4. As seen in Figure 4, the residential area has a lower SS value compared to other land uses in the study area. This variation can be due to the periodic cleaning of road surfaces by street sweepers. It can be seen that the average concentration of SS in industrial
| Land type | use | pH | TURBIDITY (NTU) | EC (mg/L) | SUSPENDED SOLIDS (mg/L) | BOD (mg/L) | ||||||||||
| MEAN | SD | CV (%) | MEAN | SD | CV (%) | MEAN | SD | CV (%) | MEAN | SD | CV (%) | MEAN | SD | CV (%) | ||
| Residential | 6.90 | 0.18 | 1.95 | 10.00 | 0.38 | 3.58 | 1066.67 | 115.47 | 10.82 | 115.73 | 10.84 | 9.39 | 2.22 | 0.04 | 1.82 | |
| Commercial | 6.57 | 0.10 | 1.64 | 8.52 | 0.13 | 1.54 | 1433.33 | 57.74 | 4.02 | 189.99 | 4.30 | 2.26 | 8.23 | 0.25 | 3.06 | |
| Industrial | 6.42 | 0.05 | 0.80 | 13.17 | 0.90 | 6.85 | 1533.33 | 57.72 | 3.76 | 394.45 | 4.32 | 1.09 | 3.17 | 0.28 | 9.11 | |
| Water Quality | Study Results | EPA Guidelines | ||||||||||||||
| Parameters | Residential | Commercial | Industrial | (EPA, 2001) | ||||||||||||
| pH | 6.90 | 6.57 | 6.42 | 5.5-8.5 | ||||||||||||
| Turbidity | 10.0 | 8.52 | 13.17 | 1-50 NTU | ||||||||||||
| Conductivity | 1066.67 | 1433.33 | 1533.33 | 1000-2500 mg/L | ||||||||||||
| Suspended Solids | 115.73 | 189.99 | 394.45 | 100 ? 400 mg/L | ||||||||||||
| BOD | 2.22 | 8.23 | 3.17 | < 20 mg/L | ||||||||||||
| Year 2019 |
| 25 |
| of Researches in Engineering ( ) Volume XIx X Issue I Version I E |
| Global Journal |
| © 2019 Global Journals |