1. I. Introduction
n Egypt, distributions of kaolinitic sandstones rocks are present in Sinai, the Eastern Desert, and the southern Western Desert, Figure 1, [1][2][3][4]. Wadi Qena is one of the largest wadies in the Eastern Desert of Egypt. It is constituted from sandstones which are represented by quartz arenite, while kaolinite is the sole clay mineral constituent. These sandstones are being inherited from felsic-granitic and reworked quartzose sediments and transported by rivers to the basin of deposition, [5][6][7][8][9][10][11][12][13][14].
Kaolinite and silica sands are belonging to the group of industrial minerals, where their characteristic features lie in their physical properties (e.g., fibrosity of asbestos, insulatory properties of mica, the high specific gravity of barite). However, kaolinite has the chemical composition Al2O3?2SiO2?2H2O. It is produced by the chemical weathering of aluminum silicate minerals like feldspar. The main use of the mineral kaolinite (about 50%) is paper production; its use ensures the gloss on some grades of coated paper. Kaolin is also used in ceramics, in toothpaste, and in paint to extend the titanium dioxide (TiO2) white pigment and modify gloss levels. In its altered metakaolin form, it is used as a pozzolan; when added to a concrete mix, metakaolin accelerates the hydration of Portland cement, [15][16][17].
The present study is devoted towards the full mineralogical and chemical characterization of Wadi Qena sandstone rock for possible separation of its main constituents: kaolin and silica sand components. Further treatment of these mineral components to satisfy the requirements of the industry is the appropriate objective. On the other hand, silica sands have got the most diversified use among all the non-metallic minerals deposits. The white silica sands are defined as high purity sands in which the sand grains are composed entirely of quartz. Impurities are very minor including for example: iron oxides, feldspars, micas, heavy minerals (zircon, tourmaline), [15][16][17]. Silica is a basic material in the glass industry, ceramic and refractory industries, and silicon-based chemicals. Silica sand is evaluated for industrial use on the basis of its chemical composition and physical properties. However, chemical specification is of paramount importance in glassmaking, whereas grain angularity and hardness are important for sandblasting, [15][16][17].
A kaolinitic sandstone sample was supplied through the Egyptian Geological Survey and Mining Authority from Wadi-Qena deposit; northern Eastern Desert of Egypt. A representative sample of which was prepared and subjected to mineralogical and chemical evaluation. The petrographic examination microscope examination of the grain composition and texture are applied using an Olympus optical microscope. Powders were prepared from the same sample and were subjected to phase and chemical analysis using a Philips PW 1730 X-ray generator with Fe-filtered Co K? radiation, run at 40 kV and 30 mA and A Philips PW Year 2018 The attrition scrubbing tests were conducted using a 5 liter Pyrex glass container of a Denver 12 flotation cell. Two attrition scrubbing scenarios according to the type of feeding material were applied. The indicator of prevailing was the amount of the produced kaolin product (the 25-micron product) and its grade concerning the optical properties, mainly the whiteness and the brightness were determined. The first scenario was the attrition scrubbing of the overall sandstone sample as received. The second scenario was to gather the 25-micron products after the separate attrition scrubbing of the dry classified the +0.60 mm fraction, the -0.6+0.10 mm fraction, and the -0.10 mm fraction. The attrition time optimized in this study. Other vital parameters like pulp solid% and the attrition impeller speed were kept constant at the maximum predetermined levels (65% solid and 2700 rpm) throughout all the experiments. The silica sand and kaolin products after the optimized attrition scrubbing process were evaluated for the local industry.
© 2018 Global Journals2. III. Results and Discussion
3. a) Characterization of the Head Sample
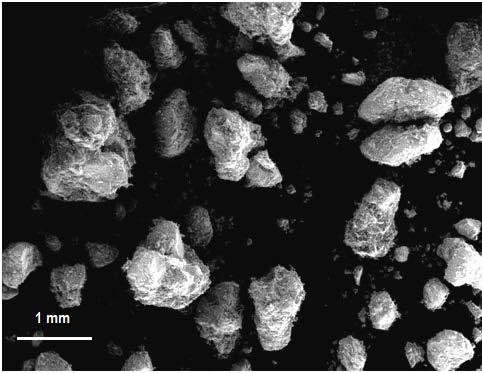
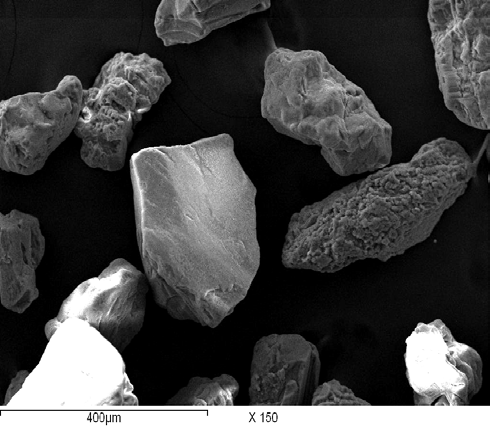
The x-ray diffraction analysis of the head sample shows the presence of silica and kaolin minerals, Figure 2. It contains 89.97% silicon dioxide, 6.95% alumina, 0.138% iron oxide, and 0.356% titanium oxide, Table 1. SEM photomicrograph shows that the original sample is composed of large to medium quartz grains cemented with white kaolin which appeared mainly as grain rimming and coatings of the silica quartz grains, Figure 3. SEM photomicrograph shows also quartz grains with conchoidal fractures, straight grooves, and crescent gouges, which suggests its deposition in moderate to high energy aqueous environments, [18][19][20][21]. The surface textures of the quartz grains indicate that they are the product of mechanical weathering, [18][19][20][21].
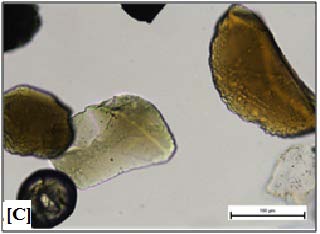
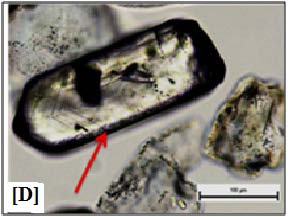
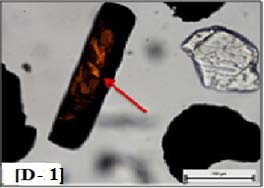
The microscopic investigation of the sample shows heavy minerals inclusions on the sand surfaces, Figure 4. After the sink/float separation (using bromo form), it is noticed that black and colored particles are more enriched in the fine fractions below 100 micron. These minerals are mainly rounded grains of zircon, tourmaline, and rutile, Figure 4. This suggests that the deposit derivation was either from igneous or metamorphic rocks, [18][19][20][21]. The presence of needle and round crystals of biotite and of fine magnetite grains was confirmed. b) The Dry/ Wet Classification of the Head Sample The chemical analysis of the dry and wet classified products shows great upgrading in the sand quality compared to the original head sample, Tables 2 and 3. The silica content increases from 89.97% in the feed sample to 96.97% in the dry classified -0.60+0.106 mm sand product. Additionally, the dry classification of the head sample helped to reduce the iron oxide content from 0.138% in the feed sample to 0.065% in the dry classified product, Table 3, with removal yield reaching 53%. The sand upgrading is due to the rejection of most iron oxides minerals, mainly magnetite below 100 micron.
In addition, the alumina content decreased from 6.95% in the head sample to 2.57% in the dry classified sand product with a removal yield reaching 63%. This is due to the separation of most of the free kaolin particles to below 100 micron, and in addition to the rejection of aluminum bearing minerals that are below 100 micron like biotite. On the other hand, titanium oxide is reduced from 0.36% in the head sample to 0.128% in the dry classified sand sample due to the separation of rutile particles by screening to below 100 micron, with 64% removal yield, Table 3.
It is noticed that wet screening of the head sample has no effect on the sand grade despite the notable change in the particle size distribution of the 0.60+0.106 mm products before and after the wet screening, Table 3. This change in the particle size distribution is due to the disintegration of the sandstone accumulations in the +0.60 mm fraction which represents 11.74% by overall weight of the head sample by just simple water showering. This data illustrates how much the clusters fragility of the present sandstone sample is, while it does not need any crushing process to disintegrate into individual grains. However, this water showering is not enough to take off the kaolin coatings that cover the surfaces of the silica grains, and this may be the reason why the grade of the washed sample is not affected by the water washing process, Table 3.
4. c) Attrition Scrubbing of the Sample
After much attrition scrubbing exploratory tests on the present kaolinitic sandstone sample, it shows that the optimum attrition time for all tested samples is 3 minutes in two steps (two min followed by 1 min). Screening on 100 microns sieve with enough water showering of the over screen product after attrition scrubbing for 2 min shows to be enough to detach the kaolin coatings away from the sand surface. Attrition Scrubbing of the 100+ micron washed sand for another 1 min is sufficient to attain complete cleaning of the sand surface and to recover the most amount of the white kaolin that coat the surface of the sand grains, Tables 4-5. The 100-micron kaolin product is further screened on 25 microns sieve to reject most of the fine silica, also of the most heaviest and colored oxides that found in the range from 100 microns to 25 microns, Tables 4-5.
On the other hand, the cumulative weight percent of the produced -0.025 mm kaolin product after the attrition scrubbing of the fractionated sand sample is 1.65+4.79+4.39= 10.83% after the attrition scrubbing of the size fractions, +0.60 mm, -0.10 mm and 0.60+0.10 mm fractions, respectively, Table 5.
5. i. Evaluation of the kaolin product
The optical properties of these kaolin fractions after the attrition scrubbing of the fractionated sand sample show lower values compared to that of the kaolin product after the attrition scrubbing of the overall sample without fractionation, Table 6. However, the kaolin product obtained after the attrition scrubbing of the 0.60+ mm fraction shows excellent optical properties measures, but it is of a relatively low weight percent compared to the head sample, Tables 5 and 6.
However, the weight percent of the produced 25-micron kaolin product after the attrition scrubbing of the head sample reaches 9.95% by overall weight, with optical properties measures reaching 79.30% brightness 85.97% iso-brightness, 92.72% whiteness, and 4.98 yellowness, Table 7.
Particle size distribution of kaolin shows that its D50 is 12.36 micron and the D80 is 23.51 micron, Figure 4. The XRD analysis of this kaolin product shows sharp narrow kaolin peaks reflect a high degree of ordering, Figure 5. Additionally, its chemical analysis shows that it contains 36.05% alumina, 47.72% silica, 0.62% iron oxide and 1.67% titanium oxide, Table 8. These chemical and optical properties specifications are matching the needs of glass and ceramics industries. However, this kaolin product needs lowering its iron and titanium oxides contents to match advanced applications like paper, cosmetic and medical industries. This issue will be covered in a separate study.
Scanning electron microscope investigation of the 25-micron kaolin product records this kaolin as vermicular, euhedral and pseudo-hexagonal plates (booklets), Figure 6. The hexagonal kaolinite plates are found either as discrete individual platelet or associated with the stacks in varying sizes (up to 30 micron). The majority of kaolinite particles show parallel orientation and have face-to-edges fluctuation.
The SEM pictures of the attrition sand product show the presence of mineral remains inside the cracks cavities of the sand grains surfaces, Figure 7. In such cases, the use of ultrasonic cleaners in high-frequency range may provide cleaning for the sand surfaces where no other means of agitation is effective. The energy imparted by ultrasonic is aggressive and specific for such cases, [22]. The microscopic examination of the attrition sand product shows varieties of colored and refractory minerals still present after the attrition process. These minerals include biotite, magnetite, rutile, zircon and tourmaline minerals. The iron oxide and alumina contents decrease from 0.138% and 6.952% in the feed to 0.036% and 0.119% in the attrition product, with removal yields reaching 74% and 83%, respectively, Table 9. The particle size distribution of the attrition product is depicted in Table 10. This product matches the sheet and Paper industries.
6. IV. Conclusion
Results show that the kaolinitic sandstone of Wadi Qena, Eastern Desert, Egypt contains notable amount of white kaolin coating the silica grains. The preferable scenario to detach this kaolin is to apply an intensive attrition scrubbing process for the whole head sample at 65% pulp solid density, 2400 rpm impeller speed for 3 min in two attrition steps separated by proper water washing step on 100 microns screen. The attrition process yields 25-micron kaolin of about 9.50% by weight of the sample. This kaolin product shows good optical properties which makes it acceptable for many domestic applications. However, it needs to minimize its iron and titanium oxides contents to match advanced applications, e.g. pharmaceutical, porcelain, and paper industries which will discuss in another issue.
On the other hand, the dry classification of the sandstone sample acts remarkable improvement in the sample grade. Further quality improving occurs after the attrition scrubbing of the whole sample. The iron and aluminum oxides decrease from 0.138% and 6.952% in the feed sample to 0.036% and 0.119% in the attrition sand product, with removal yields reaching 74% and 83%, respectively. The chemical and particle size distribution specifications of this product match the 4th grade level acceptable for plate and sheet glass industries. The attrition product needs further surface cleaning to remove the minerals remains found inside the sand surface cracks using power ultrasound treatment. Moreover, the attrition sand is in need to further processing to remove iron and heavy oxides via high intensity magnetic separation or anionic froth flotation to reach the chemical specifications of advanced types of glass applications.
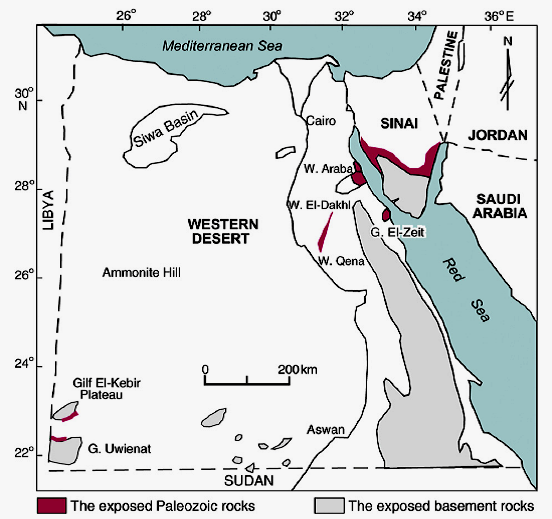
![Figure 1: Location map showing the areas of the main kaolinitic sandstones distributions in Egypt,[13]](https://engineeringresearch.org/index.php/GJRE/article/download/1823/version/101448/4-An-Egyptian-Sandstone_html/31094/image-3.png)
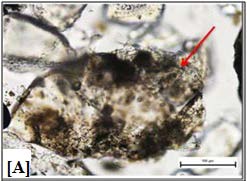
![Figure 4: Photomicrograph of different gangue minerals found in the head sample [A]: Inclusions in silica grains, [B]: iron oxides, [C]: Biotite, [D, D-1, and D-2]: different forms of Rutile, [E]: Zircon, and [F]: Tourmaline](https://engineeringresearch.org/index.php/GJRE/article/download/1823/version/101448/4-An-Egyptian-Sandstone_html/31098/image-7.png)
| Constituent | Wt.% |
| SiO 2 | 89.968 |
| Al 2 O 3 | 6.952 |
| Fe 2 O 3 | 0.138 |
| TiO 2 | 0.356 |
| SrO | 0.021 |
| CaO | 0.192 |
| Na 2 O | 0.065 |
| K 2 O | 0.022 |
| P 2 O 5 | 0.061 |
| Cl | 0.072 |
| SO 3 | 0.213 |
| ZrO 2 | 0.040 |
| L.O.I | 1.90 |
| Dry Classification | Wet Classification | |||
| Size fraction, um | Wt., % | Cum. wt., retained % | Wt., % | Cum. wt., retained % |
| +600 | 11.74 | 11.74 | 1.32 | 1.32 |
| -600 + 106 | 79.76 | 91.50 | 87.28 | 88.60 |
| -106+45 | 2.37 | 93.87 | 2.53 | 91.13 |
| -45+ 25 | 0.98 | 94.85 | 1.42 | 92.55 |
| -0.025 | 5.15 | 100.00 | 7.45 | 100.00 |
| Total | 100.00 | 100.00 | ||
| Constituent | Wt.% (dry classified) | Wt.% (wet classified) |
| SiO 2 | 96.97 | 97.050 |
| Al 2 O 3 | 2.568 | 2.530 |
| Fe 2 O 3 | 0.065 | 0.051 |
| TiO 2 | 0.128 | 0.128 |
| SrO | 0.008 | 0.008 |
| CaO | 0.070 | 0.075 |
| Na 2 O | 0.021 | 0.021 |
| K 2 O | 0.007 | 0.008 |
| P 2 O 5 | 0.017 | 0.015 |
| Cl | 0.023 | 0.021 |
| SO 3 | 0.056 | 0.054 |
| ZrO 2 | 0.036 | 0.036 |
| Size fraction, um | Operational wt., % |
| +600 | 1.35 |
| -600+106 | 84.25 |
| -106+40 | 3.00 |
| -40+25 | 1.45 |
| -25 | 9.95 |
| Total | 100.00 |
| Wt., % | ||||||
| Size fraction, mm | [A] | [B] | [C] | |||
| Opt. | overall | Opt. | overall | Opt. | overall | |
| +0.60 | 4.11 | 0.48 | --- | --- | --- | --- |
| -0.60+0.106 | 72.11 | 8.47 | --- | --- | 92.83 | 74.02 |
| -0.106+0.045 | 5.53 | 0.65 | 32.22 | 2.37 | 1.22 | 0.97 |
| -0.045+0.025 | 4.22 | 0.50 | 11.64 | 0.98 | 0.46 | 0.36 |
| -0.025 | 14.03 | 1.65 | 56.14 | 4.79 | 5.49 | 4.39 |
| Total | 100.0 | 11.74 | 100.0 | 8.50 | 100.0 | 79.74 |
| Sample Brightness% | Iso-brightness% | Whiteness% Redness% Yellowness% D 52 , um D 80 , um D 96.7 , um | ||||||
| A | 79.45 | 86.40 | 92.95 | 0.25 | 5.08 | 11.11 | 21.12 | 36.73 |
| B | 75.09 | 83.07 | 91.14 | 0.34 | 5.96 | 12.36 | 26.16 | 45.22 |
| C | 77.00 | 85.00 | 92.20 | 0.36 | 5.86 | 11.11 | 23.51 | 40.81 |
| Property | Measure, % | Property | Measure, % |
| Brightness | 79.30 | Yellowness% | 4.98 |
| Iso-brightnes | 85.97 | D 52 , um | 12.36 |
| Whiteness% | 92.72 | D 80 , um | 23.51 |
| Redness% | 0.25 | D 96.7 , um | 40.89 |
| Constituent | Wt.% | Constituent | Wt.% |
| SiO 2 | 47.72 | K 2 O | 0.04 |
| Al 2 O 3 | 36.05 | P 2 O 5 | 0.21 |
| Fe 2 O 3 | 0.62 | Cl | 0.04 |
| TiO 2 | 1.67 | SO 3 | 0.09 |
| CaO | 0.32 | ZnO | 0.01 |
| MgO | 0.16 | ZrO 2 | 0.05 |
| Na 2 O | 0.08 | Cr | 145 ppm |
| SrO | 0.133 | L.O.I | 12.8 |
| Constituent | Wt.% |
| SiO 2 | 99.754 |
| Al 2 O 3 | 0.119 |
| Fe 2 O 3 | 0.036 |
| TiO 2 | 0.038 |
| CaO | 0.023 |
| P 2 O 5 | 0.006 |
| Cl | 0.017 |
| SO 3 | 0.008 |
| ZrO 2 | 0.018 |
| Size fraction, mm | Wt.% | Cum, wt.% retained |
| -0.6 | 5.56 | 5.56 |
| -0.420 | 43.18 | 48.74 |
| -0.250 | 16.08 | 64.82 |
| -0.210 | 22.22 | 87.04 |
| -0.160 | 12.96 | 100.00 |
| Total | 100.00 |