1. Introduction
adsorbed p-anisidine was assessed using cyclic voltammetric (CV) and square wave voltammetry (SQW).
2. II.
3. Experimental a) Reagents
Potassium nitrate was dissolved into Bidistilled deionized water (BDW) to form 1mg.L -1 stock solutions. Working standards for calibration were prepared by diluting the primary stock solution with BDW. Carbon paste was supplied from (Carbon, Lorraine, ref. 9900,French). All chemicals were of analytical grade and used without further purification.
4. b) Electrodes preparation
Firstly, the carbon-paste electrode was prepared according the following procedure [13]. The carbon-paste electrode was prepared by mixing the graphite powder with paraffin oil used as a binder.
The mixture was grinding in a mortar agate and then a portion of the resulting composite material was housed in PTFE cylinder. The geometric surface area of the working electrode was 0.1256cm 2 . A bare of carbon vitreous inserted into carbon paste provided the electrical contact, and then the Phosphate natural film is electrodeposited onto carbon paste electrode. The deposit of Phosphate natural on carbon paste electrode surfaces was processed at 20 V. The current was maintained by a galvanostat with a function generator.
5. c) Apparatus
Electrochemical experiments were performed using a voltalab potentiostat (model PGSTAT 100, Eco Chemie B.V., Ultrecht, The Netherlands) driven by the general purpose electrochemical systems data processing software (voltalab master 4 software).
All the electrochemical experiments were performed in a standard one-compartment threeelectrode cell. The reference electrode was SCE and the counter electrode was platinum. All electrode potentials were referred to this reference electrode. The working electrode was natural phosphate modified carbon paste electrode (NP-CPE).
6. III.
7. Results and Discussion
8. a) Characterization of prepared electrodes
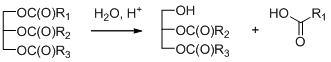
The surface structure of NP-CPE surface was observed using scanning electron microscopy (Fig. 1). The film layer of NP was formed on the surface of ara-anisidine (p-anisidine), is the most toxic [1] of the three isomers of anisidine and causes damage to the blood when ingested orally, by inhalation or skin contact. If heated strongly it can release highly toxic fumes of oxides Trogen lev- [2][3][4]. Melting and boiling point 243°C P-anisidine (PA) is colorless crystal with point 57.2 it is an important intermediate for the synthesis of dyes, medicine and fragrances, pigments, and other chemical compounds [5][6][7].
P-Anisidine reacts with secondary oxidation products such as aldehydes and ketones in the fats and oils to form products which absorb at 350 nm of light wavelength; therefore, it is used as an official method for detection them by the American Oil Company Chemistsy [8][9]. It is particularly good at detecting unsaturated aldehydes, which are those most likely to generations at unacceptable flavors, making it especially useful in food quality testing [10]. Traditional preparation of p-Anisidine uses iron powder or sodium sulfide as reducing agent [11], which reproduces a large quantity of waste and results in the problem of serious environmental pollution. [12] In this article, we describe the electrochemical analysis of p-anisidine on a modified clay carbon paste electrode. The electrochemical characterization of carbon paste electrode; it was not disintegrated or detached from the surface when immersed in the electrolytic solution (0.1M Na 2 SO 4 ). The treatment described previously gives compact particle fractions between 100 and 400µm rich in phosphate. Natural phosphate treaty has the following chemical composition: CaO (54.12%), P 2 O 5 (34.24%), F (3.37%), SiO 2 (2.42%), SO 3 (2.21%), CO 2 (1.13%), Na 2 O (0.92 %), MgO (0.68%), Al 2 O 3 (0.46%), Fe 2 O 3 (0.36%), K 2 O (0.04%) and order of several ppm metals.
9. b) Voltammetric characteristic of p-anisidine
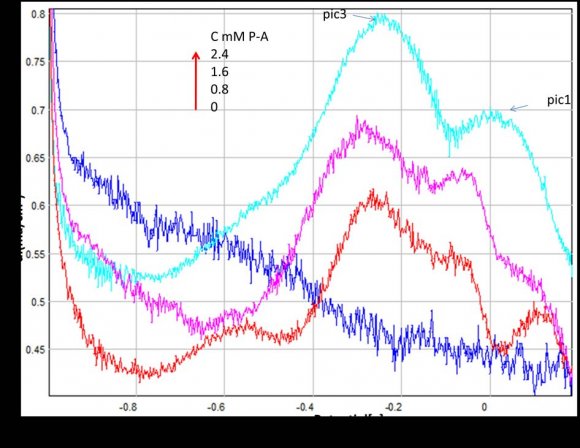
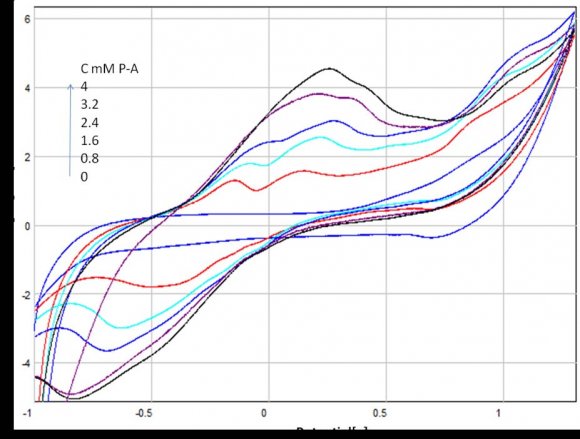
The determination of p-anisidine at the NP-CPE was performed by using cyclic (CV) and square wave voltammetry (SQW). The results are presented in Figures 2 and 3 show the CV and the SQW measurements, respectively. Two oxidation peaks were observed at NP-CPE towards the positive sweep direction, the first one around ?0. 2 V and the second at approximately 0.15 V versus SCE, scanning in the negative sense brings up a cathodic peak at -0.4V. Fig. 3 shows the square wave voltammograms obtained in 0.1 mol L ?1 Na 2 SO 4 for unmodified and modified carbon paste electrode. When the NP-CPE was dipped into the accumulation medium containing p-anisidine followed by square wave voltammetry two well defined peaks appeared. Under these selected conditions, the peak current increased linearly with the p-anisidine concentration in solution using a preconcentration time of 10 min (Figs. 4 and 5). The linear dynamic range was comprised between 0.8 and 2.4 mM in terms of the relationship between p-anisidine concentration and the oxidation peak current (Fig. 6). . The relationship can be described in the following linear regression equation in the mentioned concentration range: IP1 = 0,105[P-A] + 0,438 R² = 0,983
10. Global
11. Conclusion
A new chemically modified carbon paste electrode has been developed with natural phosphte for the determination of p-anisidine at trace levels by square wave and cyclic voltammetry. The electrode offers attractive properties such as simplicity of electrode preparation. Also, there is no leaching of the electrode because of the low solubility of the NP in aqueous solution.