1. I. Introduction
he nuclear magnetic resonance (NMR) [1] since its invention in the year 1946, has developed into a very useful and popular tool for material characterization and medical applications like magnetic resonance imaging(MRI). While the development of NMR as a technique itself is significant, the role of advancement in digital electronics in the instrumentation and techniques of NMR cannot be overstated. Since the invention of the original continuous wave NMR, digital signal processing (DSP) and advanced Fourier transform techniques have become integral part of modern day pulsed NMR techniqu e. The specificity of NMR to the nucleus has made it more useful for purposes that are less popular than routine characterization of biological molecules or MRI, where NMR of proton is mainly used. Nuclear Quadrupole Resonance (NQR) shares the same electronics and detection technique except for the presence of magnet. Observable in the non-cubic crystalline samples, NQR is not only nucleus specific but becomes compound specific making it a tool for detection, quantification and characterization of various chemicals for various purposes like remote detection of drugs, explosives or quantifying the chemicals in already packed medicines [1] [2].
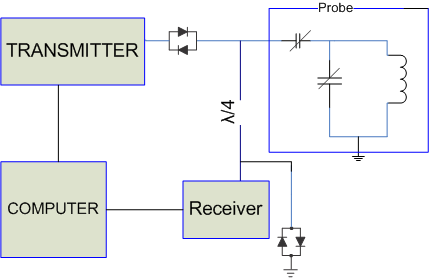
An NQR spectrometer for detection of nuclei 14 N (frequency range up to 6 MHZ) has been designed, con structed in Electronics Division, BARC is shown in Figure 1. The stable nitrogen 14 N has natural abundance of 93.6% and nuclear spin I = 1 with its associated nuclear electrical quadruple moment. The 14 N NQR transitions in various solids fall in the frequency range 0 to 6 MHz [3], hence the choice of the frequency band of our spectrometer. 14
2. II. Instrument Description
NQR instrument is designed and constructed using a digital technique which includes FPGA chip, ADCs and DACs. With the field programmability the digital part of NQR instrument could be constructed with FPGA resulting in compact and programmable NQR instrument with high sensitivity and suitable for applications such as detection of drugs, mines and plastic explosive in packages.
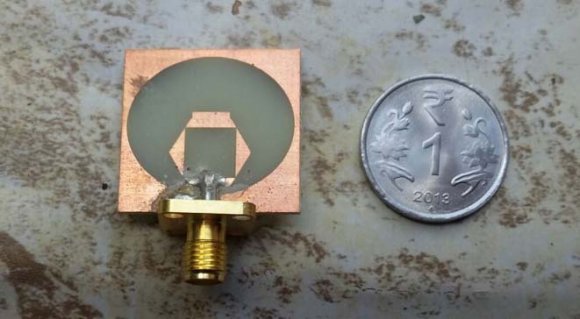
Specifications of the NQR instrument are 0-6MHz, pulse lengths 1-500 µsec and radio frequency pulse power up to 200 watts, acquisition time 50 msec. The spectrometer consists of i) Transmitter which consists of RF power amplifier. ii) Probe which consists of coil which consists of RF tuning and matching circuit. iii) Receiver which consists of preamplifier, Band pass filter, ADC. iv) FPGA module which consists of pulse programmer, DDS, gate, quadrature demodulator, FIR low pass filter. v) Computer controlled module which interface for command/data transfer. Block diagram of experimental setup is shown in Figure 1 and photograph is shown in Figure 2. In this experiment, a set of RF pulses is applied to pick up coil and the resulting magnetic moment is picked up by same coil. The radio frequency is generated by a direct digital synthesizer (DDS), and switched on and off by an RF switch controlled by pulse generator. These pulses are then amplified by a RF amplifier before going to the probe circuit. The probe circuit consists of pick up coil and pair of adjustable capacitors. The probe circuit is configured in such a way that with appropriate adjustment of capacitors, the impedance of circuit is 50.
By matching the impedance of the probe circuit to characteristic impedance of the coaxial cables carrying the signal and other components in the circuit (amplifiers etc), all of the power generated by the power amplifier is transferred to the probe circuit, and the signal generated by the probe circuit is efficiently transferred to the detection circuitry.
The precessing magnetic moment induced by applied pulses generated a voltage across the pickup coil, which is amplified by the low noise amplifier before being mixed with signal from DDS. This mixed down signal which is at frequency equal to difference between DDS frequency and frequency of the precessing spins is filtered. a) Transmitter-RF Amplifier A 500 W, 27 MHz Class AB RF power amplifier has been used for this NQR spectrometer. This has two stages and is housed in two different instrumentation bins. The total gain of the RF amplifier is 54 dB. Continuous or pulsed RF sinusoidal input to amplifier comes from FPGA (DDS and Pulse Programmer). In first stage 4 W RF power is generated and using 4:1 splitter 4 W RF power is split to get four 1W drive signals to four power stages. N channel enhancement type MOSFET has been used in power stages .Four 150 W power stages have been combined to get 500 W RF power is using 4:1 power combiner. The output power is available through a directional coupler on the front panel. The forward and reflected powers from the directional coupler are also routed to the front panel.
3. b) Probe
Probe circuit is a single coil pulsed resonance sample circuit which allows optimization in the transmitting and receiving end. In the transmitting mode the circuit is matched to transmitter output impedance 50 ohm and in receiving mode it is matched to optimum input impedance of pre-amplifier.
The probe circuit used here is parallel tuned LC circuit impedance matched to 50 ohms with a series capacitor (figure 3). The sample coil (L coil ) is made out of 17 AGW copper wire and has 32 turns of 20 mm diameter. The inductance of the coil is 6 µH. The capacitors C T and C M are high voltage (5 kV) variable (5 pf -125 pf) vacuum capacitors. In order to reduce the noise the probe circuit is shielded inside an aluminum box and is well grounded. The coils are made mechanically stable by potting them in resin based adhesive (Araldite ®).
The capacitors are varied in order to tune the circuit to the resonance frequency and match the circuit to 50 ohms for maximum power transfer from the transmitter. The approximate values of C T and ?? ?? can be calculated by following Equations [4].
? 2 LC T = 1(1)Q ?L C M 2 C T +C M = 50(2)?? ?? = 1??(R/50 ? 2 L(3)
?? ?? = ?(R / 50 ? 2 ??(4)The tuning and matching are achieved by maximizing the forward power and minimizing the reflected power. The forward and reflected power is monitored using the directional coupler built in the transmitter. Direct Digital Synthesis (DDS) [5] is a method of producing an analog waveform by generating the sinusoidal signal in digital form and then performing a digital to analog conversion. The operations within a DDS device are primarily digital therefore, it offers fast switching between output frequencies, fine frequency resolution, and operation over a broad spectrum of frequencies.
The digital part of the phase tunable and frequency fixed DDS, denoted here as DDS, is built inside FPGA as a core module, while the non-digital parts, i.e., digital to analog converter (DAC) and filter, are outside the FPGA as shown in Figure 5. The output level of a DAC is updated in synchronous with a master clock. As a consequence of discrete change in the output voltage at clock rising edges, the output of a DDS circuitry contains signal components with the image frequencies in addition to the fundamental one. The output signal is passed through a filter to select fundamental frequency.
The main components of a DDS circuitry are a p hase accumulator, phase to amplitude converter (sine lo okup table), and a DAC. It has ability to produce two independent outputs 90 o out of phase, which are mandatory for quadrature detection. Output frequency of DDS is given by equation no. 5.
?? ?????? = ?? ?? ?? ?? 2 ?? (5)where ?? is Phase tuning word (PTW)
?? ?????? is Output frequency of DDS ?? ?? is Internal reference clock frequency(CLK) ?? is Length of phase accumulatorThe resolution of DDS in spectrometer designed is Fc/2 22 =10.96 Hz.
Changes in the value of M results in immediate and continuous phase changes in output frequency. As the output frequency is increased the number of samples per cycle decreases, since sampling theory states that at least two samples per cycle are required to construct the output, the maximum fundamental output frequency of DDS is F c /2. However for practical applications the output frequency is limited to somewhat less than that the maximum, improving the quality of reconstructed waveform and permitting the filtering of output. Transmitter enable pulse is to enable the RF power amplifier in between which RF pulses are send to the probe. RF modulating pulse at resonance frequency is send to the probe for the exciting nuclei sitting in a probe. After the RF pulses the pulse programmer disables the transmitter and enables the receiver by receiver enable pulse. Now the receiver is ready to receive the signal and send to digital quadrature detector. The pulses are shown in Figure 6. The DDS is programmed to generate an RF frequency (reference frequency). This signal is routed through the phase shifter which is controlled by the pulse programmer. The phase shift is to provide pulses along the different axes in the vector model. By convention, phase shift of 0 o is an x-phase pulse, phase shift of 90 o is an y-phase pulse phase shift of 180 o is an -x-phase pulse phase shift of 270 o is an -y-phase pulse e) RF Modulating pulse RF modulating pulse can be one pulse sequence for observation of FID or a two pulse sequence for observation of spin Echo.
VHDL code has been written for the pulses to be 90 o at x and 180 o at y. The two pulse sequence is shown in Figure 7. The high power output of transmitter to the probe needs to be isolated from the sensitive receiver amplifier. This is achieved using crossed diodes and quarter wave lines [6]. Between the RF power amplifier and the probe there is a pair of cross diodes which show a high series impedance when the transmitter is off and a low impedance during the pulses. Thus between the pulses, the power amplifier and its associated noise is isolated from the probe circuit. The signal from the probe circuit passes through a quarter wave line to reach another pair of cross diodes which are shunted to ground at the input of pre-amplifier. The diode shorts the preamp end of the cable when transmitter is on, thus protecting the sensitive preamplifier from high RF power out from the power amplifier. Between pulses, the voltage across the diodes is too small to turn them on, and they act like an open circuit, letting the NQR signal pass to the preamplifier.
Though at high frequencies a suitable length of a co-axial cable like RG-58 itself can serve the purpose of a quarter wave line, at the frequencies of our interest (viz. < 6 MHz), co-axial cables are inconvenient because of the long lengths. So we have used 50 Ohm compatible quarter wave ? -sections following the method given by Fukushima et al [7].
A quarter wave transmission line acts a transformer which transforms it output impedance according to the equation. (6) where Z 0 = 50 is the characteristic impedance of the transmission line. Thus, during the pulses, when the shunt diodes are acting as short, the input impedance of the transmission line is infinite acting as if the receiving circuit were completely disconnected from the probe.
?? ???????????? = ?? ?? 2 ?? ??????????The equivalent of (?/4) cable for operating frequency as 4.64 MHz for NaNO 2 is a ? network shown in figure 8 a. NQR signal is expected to be of order of -100 dBm [8] so it needs to be amplified considerably before it can be observed on an oscilloscope. Three stages, each of which contains two amplifiers (BMC 1124, broadband RF amplifier, gain 14 dB) are connected in series as preamplifier with a gain of 84 dB and noise figure of 6.74 dB to achieve necessary level of amplification of NQR signal. Low pass filters (5 MHz) are connected after every stage to reduce Noise.
At the end of preamplifier band pass filter of bandwidth 500 KHz center frequency 4.64 MHz is cascaded to further reduce noise thus improving the signal to noise ratio.
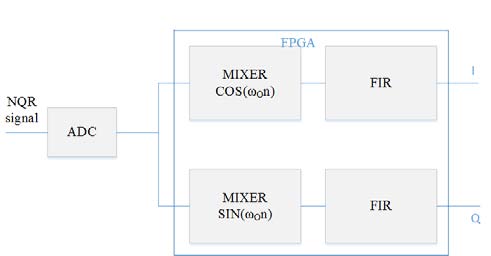
4. h) Digital Quadrature Detection
The NMR receiver design is extremely important since it directly determines the final spectrum quality. The NMR signal is first amplified to a level of perhaps several hundreds of millivolts. The signal is then passed to ADC. The ADC converts the signal from voltage to data points. This signal is then demodulated in FPGA using mixer with I and Q components of reference signal which comes as DDS output. Principle DQD technique [9], [10] works on lock in amplifi cation technique where signal is multiplied to I and Q components of reference signal (figure 9). If signal is S(n) then
?? ?? (??) = ??(??) * ??????(ð??"ð??" ?? ??) ?? ?? (??) = ??(??) * ??????(ð??"ð??" ?? ??) If ??(??) = ??????(ð??"ð??"??) Then ?? ?? (??) = ??????(ð??"ð??" ? ð??"ð??" ?? )?? + ??????(ð??"ð??" + ð??"ð??" ?? )?? ?? ?? (??) = ??????(ð??"ð??" ? ð??"ð??" ?? )?? ? ??????(ð??"ð??" + ð??"ð??" ?? )??The lower frequency component is the desired signal. In the demodulation process the signal oscillating at frequency (ð??"ð??" ? ð??"ð??" ?? ) is of interest and component at (ð??"ð??" + ð??"ð??" ?? ) are dropped off with The FIR digital filters with various cutoff frequencies can be incorporated, out of which users can select the appropriate one according to the sampling interval, or spectral width, of an individual NMR experiment.
5. j) Signal accumulator
The signal intensity of 14 N NQR seldom exceeds the thermal noise signal therefore it can be detected with high degree of reliability after multiple acquisitions. A memory module for storing the NQR signal is also prepared inside the FPGA using dual port RAM module. In the current NQR spectrometer, up to 16384 data points can be stored for each of the in-phase and quadrature signals . The stored data can be transferred to PC every scan or can be averaged n times (n ? 4096) before data transfer.
6. III. Experimental Results
7. a) NQR/NMR signal Detection
Two popular methods of observing NQR/NMR signals are: i) observe FID using a single pulse excitation. ii) Observe spin echo using a double pulse sequence. The choice of the sequence depends mainly on the relaxation time (T 2 * ) of the sample. For a long relaxation time of milliseconds as in the case for 14 N signal from NaNO 2 , a single pulse sequence is appropriate and for a short relaxation time as in the case of 1 H and 2 H double pulse sequence is used to observe a spin echo.
The main challenge for NQR techniques is the extremely poor signal to noise ratio (SNR). To improve SNR, many repetitions of the experiment are necessary. The most commonly method is to use repeated single RF pulse and acquire NQR signal after each pulse. The rate at which RF pulse has to be repeated depends on physical parameters of nuclear relaxation which are spin -spin relaxation and spin lattice relaxation. Spin lattice relaxation time is denoted by T 1 determines the time necessary to regain its original thermal equilibrium state and gives bound to how quickly a pulse sequence can be repeated. The spin-spin relaxation time denoted by T 2 indicates decoherence and thus determines the RF pulse length. In practice we can apply a pulse sequence of length T 2 and repeat the pulse sequence every T 1 . For most of explosives the relaxation times are very long which lead to long detection times [11].
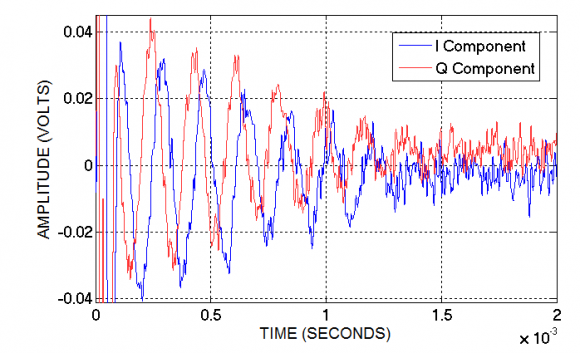
The NQR Spectrometer (Fig 1) designed has been used to observe an NQR signal from Sodium Nitrite sample.
Fig 10 shows the 14 N NQR signal in 20g of Sodium Nitrite. The observation frequency is 4.642 MHz where as the signal is off resonant by about 2500 Hz resulting in oscillatory FID. RF excitation pulse length of 20 ?sec and power of 120 W was used for excitation. The entire cycle is repeated after every 0.5 s (large compared to the spin lattice relaxation time of 0.7 ms). The signal strength is at the expected level of 6 µvolts. The NQR signal shown in Figure 10 is averaged for 1024 times.
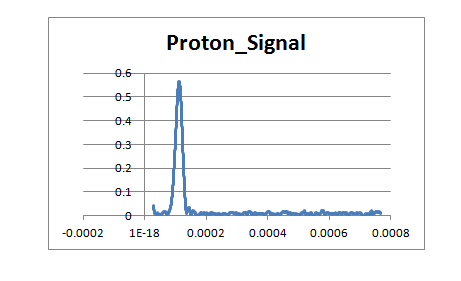
The NQR spectrometer was modified to NMR spectrometer by placing the coil in a permanent magnet. Here sample in a coil is placed between poles of a horse shoe magnet of magnetic field 1.35 K Gauss and spin echo experiment was carried out. A small quantity of ferric nitrate is added in order to reduce the T 1 of pure water and the proton signal from water is observed.


| Transmitter Module Power Amplifier | Probe Module Matching Network | Pre Amplifier | Receiver Module Band Pass Filter |
| Pulse Generator FPGA FPGA | RF Coil | Demodulator FPGA Digital | |
| FIR | |||
| Computer Controlled | |||
| Module | |||