1. Introduction
erformance test has based on dynamic analysis of the thresher. There are many sorts of the threshers to use for Combine Harvesters. This axial flow thresher is applied because it can give good performance for threshing and the least losses. Then, performance of that thresher is used by based on the shaft stiffness for this one.
The shaft is matched at the centre of it. While the shaft is operating with three forward engine speeds, the thresher will also do at the same condition. Based on the speeds, how the link of threshing losses and speeds at any positions that placed the unbalance weight on the shaft is considered.
Because of the high operating speeds and the performance from the shaft to the thresher, dynamic stiffness becomes a major design consideration. The need for dynamic analysis is especially important in the thresher of the shaft where an effective and efficient strength shaft is crucial in expending the shaft life. In the highest engine speed, the total threshing losses are very high.
It is therefore essential to be able to estimate the dynamic stiffness and ensure that the shaft can withstand such high model enables the thresher-shaft designer to modify the strength configuration for the optimum rate at high speeds level.
The result is impressive in that analysis but mathematical and dynamic model are complicated to consider. It is therefore proposed in this study a technique with consideration of any unbalance weight attachment in various speeds.
2. II.
3. Methodology a) Machine Configuration
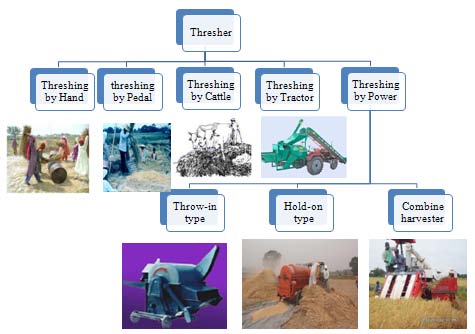
There are many sorts of the threshers in threshing the grain. This combine harvester operated axial-flow thresher was produced from KUKJE Machinery Co., ltd. (Korea). This thresher performs based on the shaft stiffness in this study. The shaft is matched at the centre of this thresher. While the shaft is operating with three forward engine speeds, the thresher also operates at the same condition. As well as harvesting method, threshing is the important practice which can affect the quantitative and qualitative losses of rice. In Myanmar's rice fields, four main types of paddy thresher are used, i.e; manual, tractor operated cross-flow type, small thresher equipped with wire loop threshing drum and combine harvester operated axial-flow thresher.
Recently, DKC-685 combine harvester operated axial-flow thresher adopted in many rice fields because of its easy application and better output for paddy thresher. It has wire-loop type peg-tooth. And, four comb types is attached entry of the thresher. All peg-teeth and drum (cover) are bolted by nuts at the threshing cylinder. It threshes the grain by axially. These are used for threshing the paddy crop. And, many different kinds of peg-tooth design and the shaft for this are applied to get good performance.
Based on the speeds, the un-threshed and total grain losses also relate by any positions that placed the unbalance weight on the shaft. Dynamic Stiffness is a function of the excitation frequency. Hence, dynamic analysis is a simple extension of static analysis. All rotating shafts deflect during rotation.
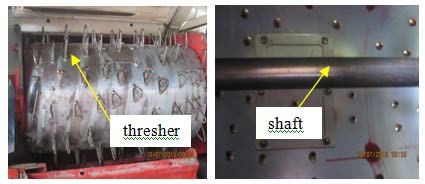
Also, using thresher and its shaft in this machine are shown in Fig. 2 The specification of the used machine tabulates in Table (1). Results data of the thresher from the design consideration are expressed in Table (2) to apply for the next determination. The evaluation of threshing systems involves a number of experiment approaches and the dynamic stiffness into the following categories. This thresher performance for all different types under study was evaluated measuring an un-threshed grain losses and total grain losses. A local long-grain paddy variety widely cultivated in Myittar Township was used for the performance. Physical characteristics of the variety are list in Table (3). The crop was cut 45-55 cm above the ground and collected for the experiments.
The paddy moisture content at harvesting and threshing was measured using moisture meter. Four levels of paddy moisture contents of 25, 21.5, 20 and 17 % (w.b.) were considered for the tests. Determination of grain moisture content accurately is important before decision of harvesting, storage and milling as shown in Table (4 To obtain the percentage of broken grain, 10 samples of 100g were randomly chosen from the outlet of the thresher. The broken grains were separated by hand from the whole paddy grains and the weight of the broken grain was recorded. In order to determine the percentage of cracked grain, at each test runs, 10 samples of 50 grains were randomly selected from the outlet of the thresher and manually husked. The husked paddy grains (Ma Naw Thu Kha) were put on a crack tester and the number of cracked kernels was recorded
[10Ali].The second parameter is workability, which is calculated consideration the dynamic stiffness of the shaft for thresher, mainly, the stiffness and mass of threshing period and potential threshing process.
Visual investigation and manual separation of 10 samples each of 100 grams were used to calculate percentage of damaged and un-threshed grains. And, grain yield was estimated by manual harvesting 5plots each of (1×1 m) with high care from random locations. Thresher performance
ii.
4. Workability
iii.
5. Percentage of total grain losses (Tgl)
The harvested plants were threshed by the thresher; the threshed grains were weight for each sample. The percentage of total grain losses was calculated from Equation (1), and (2) to determine of threshing efficiency, and then (3) for specific consumed energy:[09Els]
Where, (Pd) -Percentage of damage (Uth) -un-threshed grains (Pgl) -Percentage of grain losses where, W1 -weight of pure grain output (kg/hr), W2 -weight of residual grain in the straw (kg/hr).
The energy consumed was evaluated from the following formula, Where: Fc = fuel consumption, (L/h) Ap = Actual system productivity = Wg × Pr , (kg/hr)
6. c) Performance Analysis with Dynamic Stiffness
Dynamic stiffness generally creates images of complicated equations with limited practical value. Vibration is merely a response to other conditions in a machine [09Els].
7. d) Relation between dynamic stiffness and threshing losses based on positions and engine speeds
To determine natural frequency for the shaft with dynamic analysis, the total value of stiffness and mass of the shaft must be known. The natural frequency was calculated according to the following Equation ( 7 Optimum threshing operations as well as good systems is needed to minimize the loss and obtain maximum efficiency. So, the relation between dynamic
8. Results and Discussion
To determine how to relate dynamic stiffness and grain losses is the main contribution. It is important to be stiff because the shaft is attached inside the thresher. Operating the shaft, the thresher also operates in same time. It threshes the grain from the straw as the speed of the shaft. When the speed becomes higher suddenly, the threshing grain can be crush and damage. Also, if the stiffness of the shaft is weak, the shaft can twist and cannot operate well. So, the grain losses can be found due to weak performance.
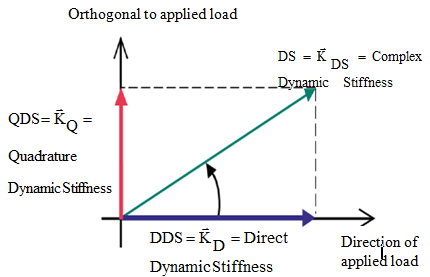
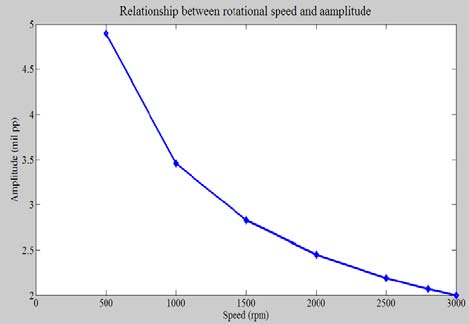
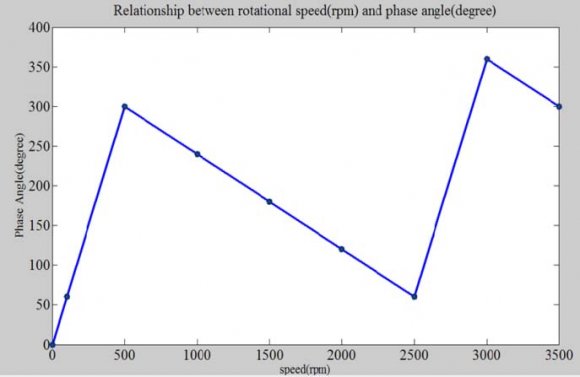
Therefore, it is vital to be stiff. In this paper, the stiffness of the shaft due to the attaching mass at any positions is determined. Moreover, the relationship of dynamic stiffness and grain losses are shown in the Fig ( 14, 15 and 16). To plot these, the relation of dynamic stiffness and losses via operating speeds is expressed in Fig ( 6). The required bode and polar plots are used to examine the response (vibration), dynamic stiffness and modal mass. These are shown in Fig. 7 approaches to the critical speed, the center of rotation begins to shift toward the CG. The phase angle between the exciting force (direction of the unbalance) and the actual vibration will be 90 degree. In this particular case, the vibration (response) amplitude lags the unbalance by 90°. So, dynamic stiffness for dynamic analysis is determined at 90° position calibration weight.
At 90 degree position, the values of stiffness decrease slightly in each engine speed (9.425, 10.2102 and 10.996 m/s. So, 903.47 N/m of stiffness can be accepted for this engine speed, 10.996 m/s. Table (8) refers to the effect of stiffness at various unbalance weight position by considering for each engine speeds. These relationships are shown by bar chart in Fig. 10. In this bar chart, the values of dynamic stiffness decrease steadily in the forward engine speeds (9.425, 10.2102 and 10.996 m/s). Also, these values become low from 30 degree to 180 degree. The highest dynamic stiffness can be found at the lowest speed. Table (10) shows total stiffness including the value of calibration weight and shaft from design consideration depends upon engine speeds. The shaft for this thresher withstands strength, resist to unbalance weight so that it is stiffness dynamically. In dynamic analysis, the value of operating speed is determined based on natural frequency and frequency ratios. In Fig. 12, the total dynamic stiffness increased with decreasing engine speeds (9.425 m/s) for the reason that less feed rate into the threshing drum resulted in less impact force on the material. The forward engine speed of machine had significant effect on decreasing quality dynamic stiffness as speed increased. Table (11) shows the result of total mass (kg) with against to engine speed (rpm) and unbalanced weight position attachment (degree) on the shaft. The design requirement must be nearly the same with the critical speed for the operating speed to approach the C.G point of the shaft. During forward engine speeds (9.425, 10.2102 and 10.996 m/s), the values of un-threshed and total grain losses by changing operating speeds are shown in Fig. 14. According to this result chart, grain losses become increased steadily in each speed by dynamic stiffness consideration. These values also depend upon frequencies ratio. As the frequency ratio increases, the grain losses will follow. So, the grain losses need to adjust balance condition for frequency ratio.
At various speeds, losses are not different, nearly equal and the least in percentage in losses. So, it is satisfied to apply as a shaft of thresher in this combine harvester. Operating speeds, un-threshed and total losses are same each various positions attaching unbalance weight in three forward engine speeds. It can be seen that at each level of drum speed tested, the un-threshed and total grain losses increased significantly as the drum speed increased from 2.1 m/s to 39.84 m/s. However, higher value of grain losses was obtained at higher drum speed. The most un-threshed and total grain losses are 3.7 % and 7.05 % at 39.84 m/s, and then the least value of 0.19 % and 0.37 % by dynamic stiffness consideration were observed at drum speed of 2.1 m/s. The results revealed that un-threshed grain losses increased steadily in the dynamic stiffness. By testing dynamic stiffness, the result of un-threshed grain losses increased significantly in experiment as the paddy moisture content decreased at 21.5, 20% and 17 % (w.b). It was observed that at each level of drum speed tested. But, the lower un-threshed grain losses observed at higher paddy moisture content with given drum speeds.
IV.
9. Conclusion
The paddy moisture content and the drum (or shaft) speeds significantly affected the total losses during paddy threshing by placed the shaft in the axialflow thresher tested. The maximum total grain losses were obtained at shaft speed 39.84 m/s, frequency ratio 0.95 and moisture content 17 % in Fig ( 14). values of total grain losses are 12.263 % and 7.05% for each theory with experiment in the paddy field and dynamic stiffness at 90 degree unbalance weight position.
The grain losses decrease in the suitable moisture content 20% (w.b). So, threshing losses was more increase than determining by dynamic stiffness. Comparing these two results, the total grain losses due to the dynamic stiffness is more satisfied than experimental field condition.
In order to minimize the effect of shaft or drum speed on total grain losses in the axial-flow thresher, it is recommended that the threshing operation should be performed immediately after crop harvesting. Performances due to dynamic analysis of the shaft for thresher have been reviewed in this paper. The two main topics include: experimental measurement techniques and dynamic stiffness of the shaft with various operating speeds.
V.

![shows, vibration can only change as the result of two things: a change in force or a change in stiffness (or both). Also, dynamic stiffness is essential for the machinery specialist.A change in unbalance is a force changing in a machine. When vibration is viewed as a ratio of forces to stiffness, the perspective changes and the focus becomes what has changed in the machine, the forces acting on its stiffness. A sudden reduction in vibration could signify an increased stiffness. If the excitation force acting on the shaft becomes higher, the Dynamic Stiffness of the shaft must also be increased by checking size of the shaft. Forces and responses (vibration) are vector quantities [08Moh].](https://engineeringresearch.org/index.php/GJRE/article/download/1334/version/101364/4-Effect-of-Dynamic-Stiffness_html/29184/image-6.png)
![Natural frequency is denoted by ?n, K means spring stiffness of shaft and M refers to mass of shaft. The total value means adding the value from unbalance weight and design consideration. Variable frequency ratio is assumed for evaluate the operating frequencies. The following Equation (8) is used to calculate operating speed [08Rji]. velocity, m/s ? = operating speed of shaft, rad/s r = radius of shaft, m](https://engineeringresearch.org/index.php/GJRE/article/download/1334/version/101364/4-Effect-of-Dynamic-Stiffness_html/29186/image-8.png)


| Parameter | Dimension | unit |
| L×W×H | 4430× | mm |
| 1860×2330 | ||
| Total displacement | 2392 | cc |
| Power / Revolution | 52 (70)/2800 | kW(hp) /rpm |
| Number of reaping | 4 | Row |
| lines | ||
| Reaping width | 1485 ± 50 | mm |
| Type | Values | unit |
| Outside diameter of | 0.43 | m |
| Thresher | ||
| Length of thresher | 0.6576 | m |
| Diameter of shaft | 0.075 | m |
| Length of shaft | 0.2334 | m |
| Thresher Weight | 105.6931 | N |
| Threshing Speed | 5.31 | m/s |
| Threshing Power | 2.1141 | kW |
| Threshing Torque | 14.94 | N-m |
| Torsional Moment | 14.9433 | N-m |
| Total Weight (UD) | 69.5038 | N |
| Total Mass | 7.085 | kg |
| Item | Description | Unit |
| Paddy grain | 3438.61 | kg/acre |
| Plant height | 80.8 | cm |
| 100 grains mass | 2.62 | g |
| Length of panicle | 6.9 | cm |
| Length of grain | 8.0 | mm |
| Width of grain | 1.9 | mm |
| Slenderness ratio | 3.4 | - |
| Operation Desired | Moisture | Primary losses | ||
| Content | ||||
| Harvesting 20-25 % | Shattering if | |||
| grain is too dry | ||||
| Threshing | 20-25 % for mechanical | Incomplete | ||
| threshing | threshing | |||
| < 20% for hand threshing | Grain damage | |||
| and cracking/ | ||||
| breakage | ||||
| Drying | Final moisture content is | Spoilage, fungal | ||
| 14% or lower | damage, | |||
| Discoloration | ||||
| Storage | <14% for grain storage | Fungle, insect& | ||
| rat damage | ||||
| <13% for seed storage | Loss of vigor | |||
| <9% for long term seed | Loss of vigor | |||
| preservation | ||||
| Milling | 14% | Grain | cracking | |
| and | breakage | |||
| over milling | ||||
| At each level of paddy moisture, six level of | ||||
| drum speed 5.89, 7.07, 8.25, 9.425, 10.603 and 11.781 | ||||
| m/s were examined. The drum speed was measured | ||||
| with a digital tachometer (Lutron DT-2236). At each test | ||||
| operate; five bundles of paddy crop were fed to the | ||||
| threshing chamber at a constant rate. | ||||
| No. | Items | Values | units | |
| 1 | Actual performance rate, P r | 0.5625 | acre/h | |
| 2 | Percentage of damage, P d | 19.231 | % | |
| 3 | Un-threshed grains, U th | 2 | % | |
| 4 | Percentage of grain losses, P gl 5.263 | % | ||
| 5 | Percentage of total grain | 12.263 | % | |
| losses,T gl | ||||
| 6 | Field efficiency, ? t | 77.49 | % | |
| 7 | Cutting efficiency, ? c | 62.87 | % | |
| 8 | Cleaning efficiency, ? cl | 90 | % | |
| 9 | Threshing efficiency, ? cl | 97.77 | % | |
| 10 | Specific consumed energy, S e 7.8× | kW.h | ||
| 10 -3 | /kg | |||
| 11 | Fuel consumption per hour | 3.08 | gal/ hr | |
| 12 | Fuel Cost per Acre | 31,197 | kyats/ac | |
| re | ||||
| 13 | Labour Cost par Acre | 13750 | Kyat/acr | |
| e | ||||
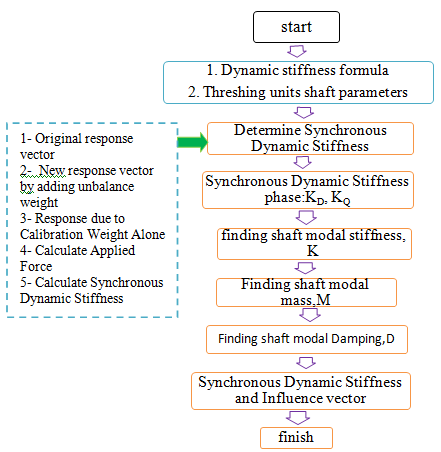
| The results at 90 degree position are shown in | stiffness and modal mass from design and unbalance | |||
| Table (6). These results are determined based on Fig 7, | weight condition. | |||
| 8 and 9. Table (7) is to compare for the values of | ||||
| Item | Parameters | Symbol | Values |
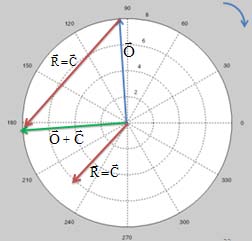
| s 1 2 3 4 5 | Original response (mil p-p) New response (mil p-p) Response due to calibration weight Applied force of calibration weight Synchronous dynamic stiffness | s ? O + = ? F DS C ? C ? K O ? R ? ? | 2.98 ? 90.6° 3.8 ? 180.6° 4.8 ? 218.71 ° 0.2902 ? 90° 4730.9 ? 129° |
| 6 | Modal mass (kg) | M | 0.0451 |
| 7 | Modal stiffness (N/m) | K | 903.4586 |
| 8 | Modal damping | D | 12.539 |
| 9 | (N.s/m) Influence vector (mil | H ? | 26.83 ? 129° |
| p-p) |
| Items | Modal mass | Stiffness |
| Shaft | 34.68 kg | 3.9716 ×10 9 N/m |
| unbalance | 0.1398kg | 2799 N/m |
| Engine | 9.425 | 10.2102 | 10.996 |
| speeds | |||
| (m/s) | |||
| Position | Stiffness | Stiffness | Stiffness |
| (degree) | (N/m) | (N/m) | (N/m) |
| 30 | 3143.427 | 2941.34 | 2799 |
| 60 | 1696.7251 | 1587.6 | 1511 |
| 90 | 1014.6117 | 949.33 | 903.47 |
| 120 | 600.5195 | 561.934 | 534.81 |
| 150 | 287.5591 | 269.0757 | 256.15 |
| 180 | 20.0446 | 18.7543 | 17.851 |
| Engine | 9.423 | 10.2102 | 10.996 |
| speeds | |||
| (m/s) | |||
| Position | Modal | Modal | Modal |
| (degree) | mass | mass | mass |
| (kg) | (kg) | (kg) | |
| 30 | 0.157 | 0.1469 | 0.1398 |
| 60 | 0.0848 | 0.0793 | 0.0755 |
| 90 | 0.0507 | 0.0474 | 0.0451 |
| 120 | 0.03 | 0.0281 | 0.0267 |
| 150 | 0.0144 | 0.0134 | 0.0128 |
| 180 | 0.001001 | 0.000937 | 0.000892 |
| Engine | 9.425 | 10.2102 | 10.996 |
| speeds | |||
| (m/s) | |||
| Position | Stiffness×1 | Stiffness×1 | Stiffness×10 9 |
| (degree) | 0 9 | 0 9 | (N/m) |
| (N/m) | (N/m) | ||
| 30 | 3.971603143 | 3.971602941 | 3.971602799 |
| 60 | 3.971601697 | 3.971601588 | 3.971601511 |
| 90 | 3.971601015 | 3.971600949 | 3.971600903 |
| 120 | 3.971600601 | 3.971600562 | 3.971600535 |
| 150 | 3.971600288 | 3.971600269 | 3.971600256 |
| 180 | 3.97160002 | 3.971600019 | 3.971600018 |
| Engine | 9.425 | 10.2102 | 10.996 |
| speeds | |||
| (rpm) | |||
| Position | Modal | Modal | Modal |
| (degree) | mass | mass | mass |
| (kg) | (kg) | (kg) | |
| 30 | 34.84 | 34.8269 | 34.82 |
| 60 | 34.7648 | 34.7593 | 34.76 |
| 90 | 34.7307 | 34.7275 | 34.7251 |
| 120 | 34.71 | 34.7081 | 34.7067 |
| 150 | 34.6944 | 34.6934 | 34.6928 |
| 180 | 34.681 | 34.68094 | 34.681 |