1. Introduction
he purpose of any asphalt mix design method is to determine the optimum proportions of aggregate and asphalt cement to be used in an asphalt pavement mix. Two empirical mix designs methods are traditionally used. These are Marshall and Hveem methods. Superpave method developed by the Strategic Highway Research Program (SHRP), is being considered for full implementation as a design method. The main advantage of Superpave over currently used mix design methods is that it is performance-based method that implies a direct relationship between Laboratory analysis and field performance after construction. Other design methods are empirical and therefore cannot accurately predict how a pavement will perform after construction (Anderson et al. 2007).
2. II.
Overview of the Superpave Method (1987-2012) Starting in 1987 (35), the Strategic Highway Research Program (SHRP) conducted research into developing new methods to specify, test and design asphalt materials and pavements. This lasted until 1993 when the Federal Highway Administration, FHWA, began implementing the SHRP research program. The Superpave design method, that was a direct result of the SHRP research, is becoming the standard for bituminous pavement design (FHWA 2006).
SHRP researches recognized that the Marshall method of mix design had been used for many years and those pavements have performed well, however, with increased traffic and heavier axle loads, it was decided that an improved method of design was needed. The Supepave mix design method was developed to fill this need. The SHRP researches envisioned a Superpave design system implemented at three levels. The level one method relied totally on volumetric analysis to determine mix proportions. The other levels of Superpave analyses require complex equipment and have not been implemented. There is ongoing research to refine Superpave with respect to quantifying the effects of aggregate size, type and gradation on the mixture and correlating these data with pavement performance. In addition, research is being conducted to develop tests for quantifying the asphalt concrete mechanical properties (Cominsky 1990).
The Superpave mix design process starts with aggregate evaluation. Aggregate characteristics are identified as either source properties or consensus properties. Source properties are defined by the purchasing agency. The WVDOH Marshall requirements in table 2.1 are used as the Superpave source property specifications, with the exception that flat and elongated property is treated as a consensus property. Consensus aggregate properties were defined by theSuperpave researches to ensure mixes made with the aggregate have good performance characteristics. The researcher envisioned that all agencies using Superpave would adopt these specifications without modification for local conditions (McLeod et al. 1956 Coarse aggregate angularity is evaluated by the percent weight of aggregates with one and more than one fractured face. The test is performed on materials retained on the (4.75)mm sieve. This is somewhat different than the WVDOH Marshall requirements that specifies the minimum percent of material with two fractured faces.
Coarse aggregate flat and elongated is evaluated by the percent mass of aggregates whose ratio of longest dimension to smallest dimension is greater than (5). Superpave limits the amount of flat and elongated particles to less than (10%). The WVDOH Marshall specification limits flat and elongated particles to (5%) based on a (4:1) ratio (McLeod et al. 1956).
3. b) Fine Aggregate Angularity(FAA)
Fine aggregate angularity, FAA, is evaluated using the Uncompacted Void Content procedure, AASHTO T304 -96 (AASHTO, 2000). The test is performed on material passing the (2.36)mm sieve. This test method was available prior to the development of Superpave, but was not a requirement for asphalt concrete mix design.
The purpose of the test is the test is to ensure the fine aggregates have sufficient angularity and texture to produce a rut resistant mix (McLeod et al. 1956).
4. c) Sand Equivalency Test(SE)
The sand equivalency test is used to evaluate the clay content of materials passing the (4.75)mm sieve. This test was implemented by some states prior to Superpave, but is a new requirement for the WVDOH (McLeod et al. 1956).
5. d) Flat and Elongated Particles Test
It is conducted according to the test method outlined in ASTM D4791. The particle is considered a flat and elongated particle if the ratio of the maximum to minimum dimension of the particle is (5:1) or more.
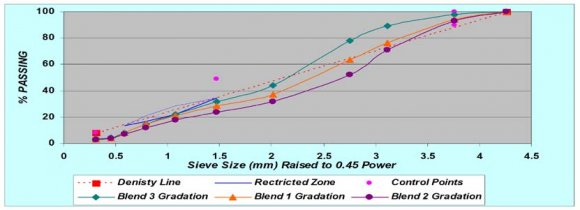
As a result CAA, FAA, elongated particles, and SE affect pavement resistance to rutting, fatigue cracking, and low-temperature cracking, and also affect production and laydown (McLeod et al. 1956). Table 2.3 shows criteria of Superpave system. The Superpave gradation specifications bands represent a minor revision as compared to the Marshall requirements. However, the concept of a restricted zone in the aggregate gradation was added to the Superpave specification to control the amount of fine material of certain sizes used in pavement mixtures. The restricted zone was introduced to limit the potential for tender mixes. The restricted zone has been removed from the WVDOH Superpave specification, in accordance with national recommendations. The gradation requirements for the 9.5 mm, 12.5 mm, and 19. 5 The Superpave process requires identifying a design aggregate structure using stockpile blends, which meet both the gradation and consensus aggregate properties. The recommended practice is to select three blends. The Federal Highway Administration has prepared a Superpave Mix design workshop that covers the details of the analysis process as presentedin the following in figure 2 The required asphalt content for each blend is estimated using general steps to estimate trial (initial) binder content as following:-1-Estimate Gse Gse=Gsb+0.8*(Gsa-Gsb)
(2.1) Where Pbi= Percent of binder by mass of mix For each aggregate blend, two samples are prepared for compaction and two samples are prepared for determining the maximum theoretical specific gravity.
Superpave samples are compacted using the gyratory compactor developed during the SHRP research. The number of the revolutions of the gyratory compactor regulates the amount of compaction effort.
Three levels of compaction effort are used in the Superpave procedure; initial; design and maximum, Ni, Nd, and Nmax, respectively. The initial level is reflective of the ability of the mixture to consolidate under low forces and is used to identify "tender" mixes. The design level compaction simulates the density of the mix immediately after construction. The maximum density level simulates the density of the asphalt after 5 to 10 years of service (Cominsky 1990). The number of gyration depends on the design situation as presented in Table 2 The bulk specific gravity is measured for the compacted samples. This is used with the measured maximum specific gravity for the volumetric analysis. The Superpave method uses the same equations as the Marshall methods for voids in the total mix, voids in the mineral aggregate and voids filled with asphalt. The Superpave method defines the dust to binder ratio as the percent aggregate passing the (0.075) mm sieve divided by the percent effective binder. The percent effective binder content is the difference between the total binder content and the absorbed binder as three following equations:- The adjusted volumetric parameters are compared to the Superpave acceptance criteria shown in Table2.7. The aggregate blend that produces the best compliance with the criteria is selected as the design aggregate structure for determining the design binder content. (Harmon, et al., 2002). If none of the aggregate blends produce a design aggregate structure with acceptable volumetric characteristics, a new aggregate blend and subsequent testing must be selected and evaluated. Finally, the moisture susceptibility of the mixture is evaluated, Six samples are prepared at the design aggregate structure and optimum binder content. Three samples are conditioned. The tensile strength of all samples is measured (Huber et al. 2007).
6. III.
Overview of the Marshall Method (kandhal et al. 1985) a) Seieving the aggregate Put all sieves above each other in familiar order, then put the sample on the sieves and shaking use the mechanical shaker for you , after that make the graded of aggregate to get the mix of aggregate that meets specification.
7. b) Mixing Asphalt with aggregate
Put the asphalt cement in an oven for (2 hr), then put aggregate mixture in container, and make check if the aggregate to be with compliance to specifications then heated to (110 º ), after that add the asphalt to aggregate in a pan and mixed through until all aggregate mixed with asphalt.
8. c) Compaction
Mould painted with oil to prevent the adhersion between the specimen and the mold, then put the mould at the bottom of compaction in the right position and filter paper was put on the bottom of the mould, then put the mixture of aggregate and asphalt in the mould and put a new filter paper on the top of the mould, then check fastness of mould and rise the hummer to max height. After that release hummer to fall vertically (50) times on the mould for each faces. After a week, weight the specimen in air and dry weight, then immersed the specimen in water for (3)(4)(5) min then weight the saturated surface dry (after dying the specimen with clothes).immersed the samples in water for (30)min and weighted it in water.
9. d) Stability and Flow test
Zero flow water to increase (4 inch) diameter cylinder in the testing head, the specimen is immersed in water path at 60C º for (30 min), then placed the specimen under the test head at constant rate, after that record the load of failure and strain at the point of failure from the results make the calculations. e) Gmm Test Specimen resulted from stability test were damaged by separating aggregate from each other IV.
10. Conclusion and Summary of the
Comparative Study
? The review of the literature demonstrates the availability of analytical and experimental methodologies that may be potentially improve the mix design. Such methods rely on the volumetric analysis for establishing the optimum asphalt content.
? The Voids in the mineral aggregate criteria are critical since they initially establish the volume of the effective binder in the mix.
? However, the current VMA criteria used by Marshall and Superpave were derived for mixes with questionable assumptions concerning the type of aggregate.
? (CAA, FAA, Flat and elongated particles, and SE) affect pavement resistance to rutting, fatigue cracking, and low-temperature cracking, and also affect production and laydown. %G mm @Nmax & % Gmm @ Ninit that are exist in SPnot %G mm @Nmax & % Gmm @ Ninit that are exist in SP Evalution of moisture Sensitivity of design mixture and determine tensile strength ratio are not exist in Marshall test.
Evalution of moisture Sensitivity of design mixture and determine tensile strength ratio which should not less than (80%).
Superpave System Versus Marshall Design Procedure for Asphalt Paving Mixtures (Comparative Study)


| WVDOH has implemented these specifications, |
| but has augmented them with requirements for skid- |
| resistant aggregates. The consensus aggregates |
| properties are;- |
| a) Coarse aggregate angularity |
| b) Coarse aggregate flat and elongated |
| 2 : Superpave Consensus Aggregate Properties 8 | ||||
| Mineral Filler | ||||
| Must meet requirements of ASTM D 242 except for gradation and must be free of harmful | ||||
| organic compounds | ||||
| Course Aggregate | Fine Aggregate | Sand Equivalency | Flat and Elongated | |
| Design Level | Angularity | Angularity | (% min) | (% min) |
| (% min) | (% min) | |||
| Light Traffic | 55%- | - | 40% | - |
| Medium Traffic | 75%- | 40% | 40% | 10% |
| Heavy Traffic | 85/80 | 45% | 45% | 10% |
| Superpave Consensus Aggregate Properties | ||||
| are shown as following: | ||||
| a) Coarse Aggregate Angularity (CAA) | ||||
| 2.3) : Criteria of Superpave System 9 | |||||||
| ESAL | CAA | FAA | SE | F & E | |||
| <100 | >100 | <100 | >100 | ||||
| < 0.3 | 55/- | -/- | - | - | 40 | - | |
| 0.3-to<3 | 75/- | 50/- | 40 | 40 | 40 | ||
| 10% | |||||||
| 3-to<10 | 85/80 | 60/- | 45 | 40 | 45 | ||
| 10-to<30 | 95/90 | 80/75 | 45 | 40 | 45 | ||
| >30 | 100 | 100 | 45 | 45 | 50 | ||
| The Coarse and fine aggregate shall be | defined in table 2.4. Gradation testing shall be | ||||||
| combined in such proportions to produce an asphalt | conducted in accordance with AASTHO T-11 (-0.075 | ||||||
| mixture meeting all the requirements defined in this | mm (NO.200) wash) and T-27. | ||||||
| specification and shall conform to the gradation as | |||||||
| Sieve Size | Superpave Mixture (Percent Passing) | |||||
| SP-9.5(3/8'') | SP-12.5 (1/2'') | SP -19.0 (3/4'') | ||||
| Nominal size | Nominal size | Nominal size | ||||
| Gradation | A | B | C | |||
| Max | Min | Max | Min | Max | Min | Max |
| 25.0 (1'') | - | - | - | - | 100 | - |
| 19.0 (3/4'') | - | - | 100 | - | 90 | 100 |
| 12.5 (1/2'') | 100 | - | 90 | 100 | - | 90 |
| 9.5 (3/8'') | 90 | 100 | - | 90 | - | - |
| 4.75 (#4) | - | 90 | - | - | - | - |
| 2.36 (#8) | 32 | 67 | 28 | 58 | 23 | 49 |
| 0.075 (#200) | 2 | 8 | 2 | 8 | 2 | 7 |
| Superpave System Versus Marshall Design Procedure for Asphalt Paving Mixtures |
| (Comparative Study) |
| Sieve Size | Boundaries of Restricted Zone Superpave Mixture (Percent Passing) | |||||
| SP-9.5(3/8'') | SP-12.5 (1/2'') | SP -19.0 (3/4'') | ||||
| Nominal size | Nominal size | Nominal size | ||||
| mm (inch) | Min | Max | Min | Max | Min | Max |
| 2.36 (#8) | 47.2 | 47.2 | 39.1 | 39.1 | 34.6 | 34.6 |
| 1.18 mm | 31.6 | 36.6 | 25.6 | 31.6 | 22.3 | 28.3 |
| (#16) | ||||||
| 0.60 mm | 23.5 | 27.5 | 19.1 | 23.1 | 16.7 | 20.7 |
| (#30) | ||||||
| 0.30 mm | 18.7 | 18.7 | 15.5 | 15.5 | 13.7 | 13.7 |
| (#50) | ||||||
| Traffic Level | ||||
| (ESALmillions) | ||||
| <0.3 | 0.3 to 3 | 3 to 30 | >30 | |
| Ni | 6 | 7 | 8 | 9 |
| Nd | 50 | 75 | 115 | 125 |
| Nmax | 75 | 100 | 160 | 205 |
| ESAL)( | % Gmm | Dust | |||||
| millons | Nini | Ndes | Nmax | VMA | VFA | Air Void | Ratio |
| <0.3 | <91.5 | 70-80 | |||||
| <1 <3 | <90.5 <90.5 | <98.0 | NA | 65-78 65-78 | 0.6-1.2 | ||
| <10 | <89.0 | 96.0 | 65-75 | 4% | |||
| <30 | <89.0 | 65-75 | |||||
| >30 | <89.0 | 65-75 | |||||
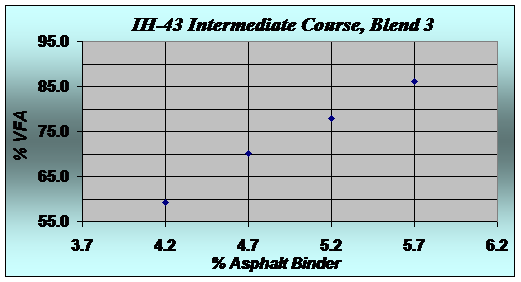
| For example for IH-Intermediate Course, Blend (3) | |||||||
| Table 2.8 : Example of Blend (3)8 | |||||||
| % AC | % Air Voids | %VMA | %VFA | ||||
| 4.2 | 5.5 | 13.4 | 59.3 | ||||
| 4.7 | 3.9 | 13.2 | 70.1 | ||||
| 5.2 | 3.0 | 13.4 | 77.9 | ||||
| 5.7 | 1.9 | 13.6 | 86.2 | ||||
| for Asphalt Paving Mixtures | |
| Superpave Mix Design | Marshall Mix Design |
| Tests in Mineral Aggregate like(CAA, FAA, SE, and F&E | Tests in Mineral Aggregate like(CAA, FAA, SE, and F&E |
| particles)are considered in the SP | particles)are not considered in the Marshall test |
| Trial (Intial) binder content is done in the SP to take an idea | Trial (Intial) binder content is not done in the Marshall test |
| about binder content before compaction | |
| Levels of compaction in Super pave System with respect to | Levels of compaction in Marshall System depends on Type of |
| (N design) which depends on:- | traffic as following: |
| 1-Average Design high air Temperture | 1-Light (ESALs<10000)---Level of compaction= 35. |
| 2-Design ESALs | 2-Median (10000<ESALs<1000000)---Level of compaction= |
| 50. | |
| 3-Heavy (ESALs>1000000)---Level of compaction= 75. | |