1. Introduction
upply Chain Management (SCM) is a principle emphasizing the utilization of an efficient integrated system of suppliers, producers, warehouses, retailers and customers, so that items can be produced and distributed system-wide at the right quantities, locations, and time to minimize costs and maximize services. A supply chain is the linkage of series of organizations with facilities, functions, processes, and logistics activities that are involved in producing and delivering a product or service. In the past, when firms manufactured in-house, sourced locally and sold direct to the customer, 'risk' was less diffused and easier to manage. With the advent of increased product/service complexity, and outsourcing of supply networks across international borders, risk is increasing and the location of risk has shifted through complex changing supply networks. Managing risk in supply chains is an important topic in supply chain management. The topic's importance is due to several industry trends currently in place: increase in strategic outsourcing by firms, globalizations of markets, increasing reliance on suppliers for specialized capabilities and innovation, reliance on supply networks for competitive advantage, and emergence of information technologies that make it possible to control and coordinate extended supply chains. These trends have manifested themselves in an increase in outsourcing and off-shoring of manufacturing and R&D activities, low cost country (LCC) sourcing, and collaboration with international supplier partners. While these increase the strategic options for firms, they also increase the probability of experiencing adverse events in supply chains that significantly threaten normal business operations of firms in the supply chains. Along with the increase in these initiatives, there has been an increase in the potential and magnitude of supply chain risks. Many industrial cases have shown different outcomes after risk events due to diverse actions (or lack of action) taken in facing supply chain disturbances and disruptions. One typical example is Ericsson's crisis in 2004. Since Ericsson used a single-sourcing policy, a fire accident in its chips' supplier immediately disrupted the material supply. Ericsson's loss was estimated to reach USD 400 million for its T28 model.
2. a) Risk
Risk can be broadly defined as a chance of danger, damage, loss, injury or any other undesired consequences. A more scientific definition of risk was provided by the Royal Society (1992): ''the probability that a particular adverse event occurs during a stated period of time, or results from a particular challenge". i. Sources of Risk a. Supply Risk Supply risk relates to potential or actual disturbances to the flow of product or information emanating within the network, upstream of the focal company. Therefore, it is risk associated with a company's suppliers, or supplier's suppliers being unable to deliver the materials the company needs to effectively meet its production requirements/demand forecasts. It adversely affects inward flow of any type of resource to enable operations to take place; also termed as 'input risk'. It includes. Controls are the assumptions, rules, systems and procedures that govern how an organization exerts control over the processes. In terms of the supply chain they may be order quantities, batch sizes, safety stock policies etc. Control risk is therefore the risk arising from the application or misapplication of these rules. It includes.
3. ? Inappropriate rules that distort demand
? Poor visibility along the pipeline
4. Environmental Risk
Environmental risk is the risk associated with external and, from the company's perspective; uncontrollable events. It consists of any uncertainties arising from the supply chain and environmental interactions. These may be the result of accidents, manmade or natural disasters. It includes.
5. ? Natural disasters
? Terrorism and war
6. ? Regulatory changes
7. ? Strikes
Following figure shows some of the Risk sources and their characteristics.
8. b) Risk Management
It is a process of measuring or assessing risk and then developing strategies to manage the risk. Risk management is the broad activity of planning and decision making designed to deal with the occurrence of hazards or risks. Risks include both unlikely but highimpact disruption risks, as well as more common volatility in demand, internal processing, and supply. Some of the factors impacting exposure to Risks are also given below: i. Customers reactions.
ii. Competitor reactions. iii. Supplier reactions. iv. Government reactions.
9. III.
10. Summary of Literature Review
Increasing product/service complexity, outsourcing and globalisation have led to complex and dynamic supply networks, there by increasing the factors impacting exposure to risks. The review shows various types of risks and there classifications based on different categories which affects the Supply chain operations. It also addresses the importance of Supply chain Risk Management (SCRM) to make decisions that Year 2014 optimally align organizational processes and decisions to exploit opportunities while simultaneously minimizing risk. Understanding the types of risks and their probability of occurrence as well as the associated impacts is a starting point for companies to develop effective Risk Management strategies.
IV.
11. Problem Description
To gain cost advantage and market share, many firms implemented various initiatives such as outsourced manufacturing and product variety. These initiatives are effective in a stable environment, but they could make a supply chain more vulnerable to various types of disruptions caused by uncertain economic cycles, consumer demands, and natural and manmade disasters. The objective of the problem is to maximize productivity by reducing Supply Chain Risks. In this work, an effective method for managing 'Supply chain Risk' in a manufacturing industry involving in Casting is proposed with aid of a flow chart and a strategy is developed for its Mitigation. a) Identification of Problem SCRM is viewed as "the management of supply chain risk through coordination or collaboration among the supply chain partners so as to ensure profitability and continuity". Risk management is the process of measuring or assessing risk and then developing strategies to manage the risk. These strategies can involve the transference of risk to another party, risk avoidance or mitigation, and channel risk sharing. SCM risk assessments balance the probability of demand, the likelihood of reliable supply, the most effective allocation of resources, and the probability of success of new product introductions, market conditions, and the opportunity costs of alternative decision paths. A framework for Supply Chain Risk Management is shown below: A solid risk analysis process could identify the impact of disruption on supply chains. This could be established by monitoring supply chain performance, for example the production or financial performances. With a proper implementation of risk control, for instance via risk mitigation strategies, the impact of disruption on flows could be diminished, or even avoided.
12. b) Objectives
The main objective is to analyse how supply chain risks can be effectively managed. Firstly, this is done by positioning the agenda in supply chain risk management (SCRM). Then, methods for effective management of supply chain risk are identified and analysed.
Based on the framework shown above, we can classify the objective into two sub-categories Objective I: Identifying Supply Chain Risk Management Agenda.
It is important to identify the current agenda in this field. The exploration of various definitions, for both terminology and processes involved in this area, helps to clarify future scope. To achieve this objective, we hereby raise two questions as follows:
Objective II: Identification of Effective Management of Supply Chain Risk.
The second objective focuses on finding how supply chain risk can be effectively managed. To achieve this objective, an investigation of selected approaches and methods will be conducted to analyse their competency and robustness in sustaining supply chain operations. Hence, to achieve the above objective, we raised three questions that focuses on risk analysis and risk control.
13. Proposed Methodology
Supply chain Risk Management process can be mainly classified into two categories:
? Risk Analysis. ? Risk Control.Risk Analysis deals with Identification, Estimation and Evaluation of risks, whereas Risk Control deals with Mitigation and Monitoring of risks. The Risk Management process can be developed with the aid of a flow chart which is shown below.
14. Management
Risk Management process which is constituted of two main elements; Supply chain Risk Analysis and Supply chain Risk Control, henceforth referred to risk analysis and risk control respectively. The term risk assessment is also interchangeably used in referring to risk analysis. The first process covers the identification, estimation and evaluation of risk. Proper implementation of all stages in this process will result in the recognition of potential risk events affecting supply chain. However, not all risk events fall under the category of disruption risk events, and therefore the potential impact caused by an individual risk event needs to be carefully estimated and evaluated according to the individual supply chain operation's definition.
15. a) Risk Identification
A key aspect of supply chain risk management is identification. Identification involves creating a list of potential events that could harm any aspect of the supply chain's performance. Risk identification allows an organization to take steps to create plans to manage risks before they occur. This is typically more cost effective then waiting to react to adverse events when they occur.
16. i. Methods for Identifying Risk
Geomapping/Supply chain mapping -Visual maps of supply chains reveal supply chain structures, dependencies, and handoffs that may contain risk. Supply Chain Operation Reference (SCOR) mapping and Value Stream Mapping are two types of supply chain mapping that can be used. Looking at historical problems -Historical problems may have a high chance of recurring. Those problems may have happened to the organization itself or to others. Researching industry trends -Other organizations and industry groups may have already researched risks that are applicable. Group of experts brainstorming -People with experience in different areas of your organization and supply chain have lots of knowledge of risks. Getting them together increases the knowledge sharing. (The Delphi method is one technique to conduct expert interviews.) Assessment surveys -Well designed surveys can be an effective way to quickly gather information on risks in your supply chain. Site visits -Site visits to supply chain partners allow you to collect detailed and less "filtered" information on risks. Information audits -Data system audits can reveal issues and trends from the past. It can show areas of the supply chain that have had poor performance in the past and are thus more likely to perform poorly in the future.
ii. Tools used in risk identification Risk checklists -a list of risks that are common for our environment. It may come from past experience or industry research. Cause-and-effect diagrams -a diagram that traces back the causes for events. Gantt charts -a bar chart showing the precedence and timing of activities. It can help identify the critical path, i.e. the most critical organizations and processes that would be bottlenecks if they experienced a disruption. (It can also be used later during Risk Assessment to determine the effect of disruptions at different points in a supply chain).
17. RISK ANALYSIS
18. RISK IDENTIFICATION RISK ESTIMATION RISK EVALUATION
19. RISK CONTROL
20. RISK MITIGATION RISK MONITORING
Supply Chain Risk assessment provides management with an understanding of where the greatest risks may exist in order to prioritize resources for risk mitigation and management. Performing such b) Risk Assessment and Evaluation Risk Assessment and Management in Supply Chain FQ4: What kind of mitigation policies should be used for managing risk in supply chains? FQ5: What modelling techniques and approaches are possible in this area? Year 2014 assessments will involve clarifying the nature of the risk, understanding conditions that may lead to the event, knowing how frequently such events have happened or can be expected to happen, and the potential impact of such events. The team can then prioritize addressing the risks. Risk assessment is typically made up of two measures: Likelihood and Impact. Likelihood-measures the probability that the event will occur. The exact probability may be difficult to determine unless there is historical data that can be used to find the frequency of the event occurring. Alternatively an organization can use a subjective likelihood, or degree of belief, based on the opinions of experts. A time horizon is necessary to define the probability in a useful way (e.g., the likelihood that an event will occur in the next year or 50 years). Impact -measures the consequences on the organization if the event occurs. It can be measured directly, for example in terms of dollars. It can also be measured on a scale, for example from zero to one with zero being very little negative consequence and one being a very bad consequence. Methods for measuring impact include "what-if" simulations, financial models, and opinions of teams of experts. Impact may also be measured in terms of other SCOR metrics besides financials. Summary risk score -A summary risk score can be calculated for each risk by multiplying the Impact times the Probability to get an expected value of the risk. Then risks can be ranked by risk score. Also the risks can be shown on a map or graph. An example is shown below.
Qualitative Risk assessment i. Tool used in Risk Assessment Failure Mode Effect Analysis (FMEA) -It is used to prioritize the risk using Risk Priority Number (RPN), which can be calculated from probability of occurrence, severity and detection of risk and also using Risk Score Values (RSV) in which Severity and Occurrence of risk is calculated.
Other methods for assessment include:
? Fault tree analysis -This is a graphical technique that provides a systematic description of the combinations of possible occurrences in a system, which can result in an undesirable outcome. This method can combine hardware failures and human failures. The most serious outcome is selected as the "Top Event". A fault tree is then constructed by relating the sequence of events, which individually or in combination, could lead to the top event. FTA is both a design and a diagnostic tool. As a design tool FTA is used to compare alternative design solutions and the resulting Top event probability. As a diagnostic tool FTA is used to investigate scenarios that may have led to the Top event.
? Event tree analysis -Event tree analysis (ETA) is an analysis technique for identifying and evaluating the sequence of events in a potential accident scenario following the occurrence of an initiating event. ETA utilizes a visual logic tree structure known as an Event Tree (ET). The objective of ETA is to determine whether the initiating event will develop into a serious mishap or if the event is sufficiently controlled by the safety systems and procedures implemented in the system design. An ETA can result in many different possible outcomes from a single initiating event, and it provides the capability to obtain a probability for each outcome.
21. c) Risk Monitoring and Mitigation
Once areas of risk have been identified, an organization needs to monitor their internal and external environment. This helps them to predict when risky events are becoming more likely. It also helps to identify new risks and is tightly linked to the best practice of Supply Chain Risk Identification. Supply Chain Operation References focus on supply chain metrics enables Supply Chain Risk monitoring. Real time metrics and periodic reports give decisions maker's knowledge upcoming risks. Statistical analysis of key metrics can reveal trends. Visibility into supplier and customer metrics increases the ability to monitor. Reports on risk monitoring can be combined with existing management reviews and meetings. Monitoring can also include monitoring qualitative sources of information such as news or weather reports to identify events that are precursors to risks. In the Plan step, an organization can plan methods for monitoring Source, Make, Deliver, and Return risks. These methods may include specific metrics to monitor and "watch-out" lists of precursor events. It may also include monitoring the environment external to the organization's supply chain. ? Deliver risk monitoring can be done with customer service metrics. ? Make risk monitoring can be done automatically through an organization's data systems such as an ERP system. ? Source risk monitoring is enhanced with visibility into suppliers' metrics.
It is important to monitor indicators that would appear early in a risk event or, better, even before it occurs by indicating an increasing likelihood. If monitoring only reveals a risk well after its first occurrence, it will likely be too late to adequately respond to it. Monitoring can also be used to test the effectiveness of risk controls. If a plan to mitigate or prevent a risk has been implemented, monitoring can check to see if the corresponding metrics show no signs of the risk occurring. Five operational strategies for managing disruption risks are given below:
22. Strengthen Supply Chain
Work with suppliers to reduce the frequency and/or severity of supply problems.
23. i. Risk Mitigation Strategies
? Multiple sources of supply: -having multiple sources of supply for a raw material reduces the impact of one source failing to deliver materials.
? Strategic agreements or partnerships with suppliers:
-strategic agreements with suppliers can lead to continued service in the event of capacity constraints.
? Collaborative Planning Forecasting and Replenishment (CPFR): -by sharing demand and fulfilment data with supply chain partners, there is a reduced risk of unforeseen demand swings or supply shortages.
? Joint product design and delivery: -designing products with suppliers reduces the risk of material non-performance or material shortages.
24. d) Supply Chain Operation Reference (Scor) Model
Supply Chain Operations Reference (SCOR) model provides a unique framework that links performance metrics, processes, best practices, and people into a unified structure. The framework supports communication between supply chain partners and enhances the effectiveness of supply chain management, technology, and related supply chain improvement activities. It features an intentionally broad scope and definitions that can be adapted to the specific supply chain requirements of any industry or application.
SCOR is based on Five Core management process:
25. i. SCOR Performance
The performance section of SCOR consists of two types of elements: Performance Attributes and Metrics.
26. a. Performance Attributes
A performance attribute is a group of metrics used to express a strategy. An attribute itself cannot be measured; it is used to set strategic direction. SCOR identifies five core supply chain performance attributes: Reliability, Responsiveness, Agility, Costs, and Asset Management. Consideration of these attributes makes it possible to compare an organization that strategically chooses to be the low-cost provider against an organization that chooses to compete on reliability and performance.
27. b. Metrics
A metric is a standard for measurement of the performance of a process. SCOR metrics are diagnostic metrics. SCOR recognizes three levels of predefined metrics:
? Level 1 metrics are diagnostics for the overall health of the supply chain. These metrics are also known as strategic metrics and key performance indicators (KPIs). Benchmarking level 1 metrics helps establish realistic targets that support strategic objectives.
? Level 2 metrics serve as diagnostics for the level 1 metrics. The diagnostic relationship helps to identify the root cause or causes of a performance gap for a level 1 metric.
? Level 3 metrics serve as diagnostics for level 2 metrics.
28. ? Alignment of supply chain team skills with strategic objectives
? A detailed game plan for launching new businesses and products ? Systematic supply chain mergers that capture projected savings In this work, a Case study is taken up to develop an effective method for managing 'Supply chain Risk' in a manufacturing industry involving in Casting, by collecting the sample data and a strategy is developed for its Mitigation. AutoKast Ltd, a Casting industry undertaking by Government of Kerala is taken here as the case study. The industry is fully equipped to manufacture all kinds of Ferrous Castings weighing from 20 kg to 8000 kg single piece. The present annual production capacity is 6000 Metric Tons. AutoKast produces and markets different grades of Grey Iron and SG Iron Castings for the domestic and international markets.
29. VI.
Case Study: Risk Assessment and Management in Casting Industry a) Risk Identification Sources of risk i. Demand Risk It is the occurrence of an undesired event, which is mostly caused by fluctuation in customer demand. Forecast becomes more inaccurate if the fluctuation is really high, and the further result from forecast inaccuracy is the bullwhip effect as the most undesired outcome from this risk.
ii. Supply Risk It refers to the increments of purchasing cost that is caused by price increase from suppliers, delivery delay from suppliers that can increase production cost, quality cost because of the low quality of inbound materials or even defects.
iii. Operational Risk It is being the risk that has an effect on a company's internal ability to produce goods or services.
30. iv. Environmental Risk
Here several factors which were taken into consideration are technological, social, political and economic circumstances. However, natural phenomena, such as geological, metrological, disease and any other uncontrollable events have to be taken into consideration too.
31. b) Risk Assessment
To develop the risk mitigation strategies, the risk that constitutes the supply chain operations has to be identified using an effective tool. The method of assessment follows Failure Mode Effect Analysis (FMEA) guidelines. The concept of assessing the risk basically uses the score for the probability of the risk occurrence, the impact from the risk, and the identification method that the firm has to reduce the impact of the risk. All the values are calculated to obtain the risk priority number (RPN) and risk score value (RSV) by using the formula below. Failure mode effect analysis is used to prioritize the risk using Risk Priority Number (RPN), which can be calculated from probability of occurrence, severity and detection of risk and also using Risk Score Values (RSV) in which Severity and Occurrence of risk is calculated.
32. i. Occurrence Rating Scale
Estimation of likelihood that a failure will occur. iii. Detection Rating Scale How likely will the failure be detected?
33. Remote
The risk can be detected with manual inspection but no process is in place so that detection is left to chance 5
34. Moderate chance of detection
There is a process for double-checks or inspection but it is not automated and/or is applied only to a sample and/or relies on vigilance 4 3
35. High
There is 100% inspection or review of the process but it is not automated 2 Very High There is 100% inspection of the process and it is automated 1
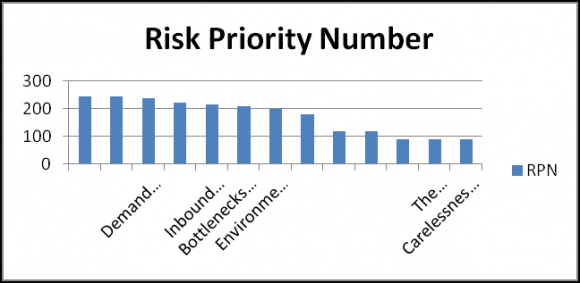
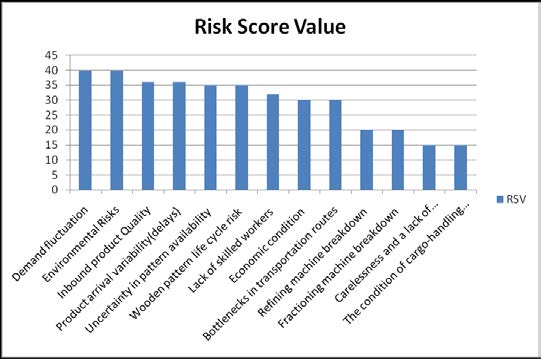
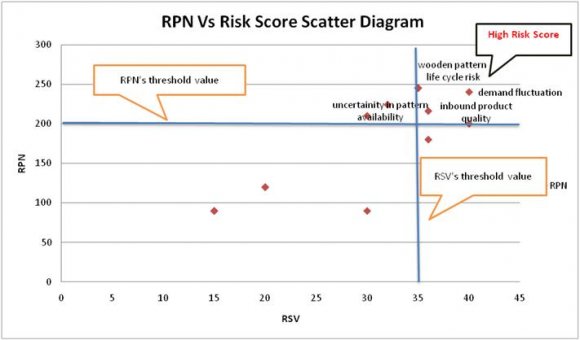
Almost certain There are automatic "shut-offs" or constraints that prevent risk d) Sample Data Collection Risk has to be prioritized before adopting effective mitigation strategies. All the inherent risks have been identified and the next stage is to assess each risk by using the FMEA method. Every risk is assessed by its likelihood value, impact value and detection method value. Determining those values is based on the secondary data and interviews with the experts. By having Chief Operating Officer, Procurement Manager and Distribution Manager as the key informants, the quality of the data and analysis is highly enhanced. All the informants enter values for the probability, impact and detection methods for each risk, and then they are adjusted by using past historical data (sales, volume of productions, suppliers performance and the occurrence of risks). All the values which informants have given in the interviews are shown below: i. Tabulated Risk Score Values The 80:20 rules says that 20% of the work can gain 80% of all the benefits that can be obtained. Once the supply chain risk has been identified and assessed, information about the level of urgency of the risk can be obtained. Since the level of risk has been revealed, those high scored risks have to be mitigated by using specific supply chain strategies. Supply chain operations in a Casting industry. It shows three out of the four highest risks are of the supply type; inbound product quality, wooden pattern life cycle risk and uncertainty in pattern availability. The other risk is categorised as demand risk. The risks which categorised under the supply are mostly caused by the supplier. The impact of the low quality of the inbound products affects the quality of Castings. The key tool for mitigating this risk is by making good relationship with the supplier. Implementing collaborative relationships with the suppliers are extremely desirable to reduce or to prevent the occurrence and impact of the risk such as uncertainty in pattern availability. It supports the improvement of flexibility and ability of firm, thereby reducing the risk. Mitigation of supply risk can also be done by redundant suppliers (reconfiguring supply base). This strategy increases supply flexibility for the firms due to having more suppliers, and it automatically increases the buyer's bargaining power. The choice of which strategy is the most suitable for the casting supply chain entirely depends on the nature of the firm and its external parties.The fluctuations in demand are inherent in many Supply chain operations. The effect of these risks is decreased forecast accuracy, thus it might increase the cost of inventory or stock. In order to mitigate these risks, the firm can use pool or aggregate demand, which is termed as "Risk pooling". The impact of fluctuations in demand can be also be reduced by using postponement strategy in which the process starts by making a generic or family product that is later differentiated into specific end-product. A framework of Risk Mitigation Strategies for company's Casting Supply chain is shown below: VII.
36. Conclusion
The idea behind working on this project was to make aware the industries that neglecting the risks involved behind the supply chain increase their losses. Impacts of these risks and their occurrences can be minimized or even nullified. The SCOR model can play a substantial role in pursuing the overall objective of a real collaborative process within and between companies, aiming at maximizing the overall performances of the supply chain with reduced risk.
Here the given sample data gives the company's exposure to risk for the daily production process. So an effective Supply Chain Risk Management (SCRM) needs to be implemented in procurement and production process.
37. a) Future Work
The Future work of the thesis includes developing Risk Mitigation strategies that suits to the Industry scenario and also Cost benefit analysis is to be carried out by collecting real time data.


| 1 : Operational strategy for managing | ||||
| disruption risk | ||||
| Operational | Description | |||
| Strategy | ||||
| Stockpile Inventory | Hold inventory that can be used to | |||
| fill customer demand even if supply | ||||
| is interrupted. | ||||
| Diversify Supply | Source product from multiple | |||
| vendors/facilities so that a problem | ||||
| at one vendor/facility does not | ||||
| affect the entire Supply. | ||||
| Backup Supply | Have an emergency supplier (or | |||
| logistics provider) that is not | ||||
| normally used but that can be | ||||
| activated in the event of a Supply | ||||
| problem. | ||||
| Manage Demand | Influence demand to better match | |||
| the actual supply by, for example, | ||||
| adjusting | prices | or | offering | |
| incentives to encourage Customers | ||||
| to purchase products that are less | ||||
| supply-constrained. | ||||
| 2 : SCOR process | |||
| SCOR | DEFINITIONS | ||
| PROCESS | |||
| Processes that balance aggregate | |||
| PLAN | demand and supply to develop a course | ||
| of action which best meets sourcing, | |||
| production and delivery requirements | |||
| Processes that procure goods and | |||
| SOURCE | services to meet planned or actual | ||
| demand. | |||
| Processes that transform product to a | |||
| MAKE | finished state to meet planned or actual | ||
| demand. | |||
| Processes that provide finished goods | |||
| DELIVER | and services to meet planned or actual | ||
| demand, typically including order | |||
| management, | transportation | ||
| management | and | distribution | |
| management. | |||
| Processes associated with returning or | |||
| RETURN | receiving returned products for any | ||
| reason. | |||
| 3 : SCOR Level 1 metrics | ||||
| Perspectives | Metrics | Measure | ||
| On-time | ||||
| delivery | Percentage | |||
| Supply reliability | chain | Order fulfillment lead time Fill rate | Days Percentage Percent | |
| Perfect order | age | |||
| fulfillment | ||||
| Supply chain | ||||
| Flexibility responsiveness and | response time Upside production | Days Days | ||
| flexibility | ||||
| Supply chain | ||||
| management | ||||
| Expenses | cost Warranty cost as percentage of revenue | Percentage Percentage Dollars | ||
| Value added | ||||
| per employee | ||||
| Total inventory | ||||
| Assets/utilization | days of supply Cash-to-cash cycle time Net asset | Days Days Turns | ||
| turns | ||||
| ii. Benefits of adopting the SCOR model | ||||
| ? Rapid assessment of supply chain performance | ||||
| ? Clear identification of performance gaps | ||||
| ? Efficient supply chain network redesign and | ||||
| optimization | ||||
| ? Enhanced operational control from standard core | ||||
| processes | ||||
| ? Streamlined | management | reporting | and | |
| organizational structure | ||||
| 1 : Occurrence rating scale | ||
| Rating | Description | Potential Risk Rate |
| 10 | Certain probability | Risk occurs at least once |
| a day or risk occurs | ||
| almost every time | ||
| 9 | Risk is almost | Risk occurs predictably or |
| inevitable | risk occurs every 3 or 4 | |
| days | ||
| 8 | Very high | Risk occurs frequently; or |
| 7 | probability | risk occurs about once |
| per week | ||
| 6 | Moderately high | Risk occurs about once |
| 5 | probability | per month |
| 4 | Moderate | Risk occurs occasionally |
| 3 | probability | or risk occurs once every |
| 3 months | ||
| 2 | Low probability | Risk occurs rarely or Risk |
| occurs about once per | ||
| year | ||
| 1 | Remote probability | Risk almost never occurs |
| no one remembers last | ||
| risk occurrence. | ||
| ii. Severity Rating Scale | ||
| Table 5.2 : Severity rating scale | ||
| Rating | Description | Definition |
| 10 | Certain probability | Risk could cause loss |
| of client | ||
| 9 | Risk is almost | Risk could cause major |
| inevitable | or permanent delay | |
| 8 | Very high | Risk causes minor to |
| 7 | probability | moderate delay with a |
| high degree of client | ||
| dissatisfaction | ||
| 6 | Moderately high | Risk causes minor |
| 5 | probability | delay with some client |
| dissatisfaction | ||
| 4 | Moderate | Risk causes very minor |
| 3 | probability | or no delay but annoys |
| client | ||
| 2 | Low probability | Risk causes no delay |
| and client is unaware | ||
| 1 | Remote probability | Risk causes no delay |
| and has no impact on | ||
| system | ||
| 3 : Detection rating scale | ||
| Rating | Description | Definition |
| 10 | No chance of | There is no known |
| detection | mechanism for | |
| detecting the risk | ||
| 9 | Very | The risk can be |
| 8 | Remote/Unreliable | detected only with |
| thorough inspection | ||
| and this is not | ||
| feasible or cannot be | ||
| readily done | ||
| 7 | ||
| 6 | ||
| 4 : Risk Score Values |
| Casting Supply chain | |||
| Category of | Risk | Level | Mitigation |
| Risk | of | Strategies | |
| Risk | |||
| Fluctuating | High Collaborative | ||
| demand | forecast | ||
| Demand Risk | planning. | ||
| Economic | Low | ||
| condition | Product | ||
| postponement. | |||
| Inbound product | High Reconfiguring | ||
| Quality | supply base | ||
| Product arrival | Low | (add more | |
| variability(delays) | suppliers). | ||
| Wooden pattern | High | ||
| life cycle risk | Increase of | ||
| Supply Risks | Uncertainty in | High | patterns level |
| pattern availability | (safety stock | ||
| Bottlenecks in | Low | level). | |
| transportation | |||
| routes | |||