1. Introduction
ubeSats are satellites that adopt physical cubical in shape with typical dimensions of 10 cm edge and maximum mass of 1.33 kg [1]. The interest of cubesat (CS) addressed in this work is to act in an orbit "sun synchronous" with a duration of 96.5 minutes, and the period of 62.73 minutes with the possibility to receive solar radiation, and perform 14 laps around the Earth each day.
Photovoltaic panels for energy generation are installed on all external surfaces of the structure, configured to form a set of four photovoltaic cells connected in series circuit that can provide the level of voltage of 10.79 volts open circuit and capacity generate current under short-circuit of 200.2 mA. The CubeSats's specifications stipulate that they have to be placed in orbit with its batteries supply power in the "off" state, and these batteries must only be connected to the electrical system when the CubeSats are in their final orbits [1].
Due to this feature being planned for the launch phase and flight of the spacecraft that will carry the cubesat (CS) to orbit operation, it is necessary that the components and / or subsystems installed on cubesat (CS) are tested to evaluate the behavior of electronic and electrical components, and mechanical structure before operation in orbit, in order to prove a reliability level consistent with the application in question.
In this context, this paper proposes a model to simulate the energy produced by photovoltaic panels in order to perform the test charge and discharge batteries that are provided in the distribution system of energy that supplies the electrical and electronic components installed in cubesat (CS).
The validation of the simulation discussed in this article is primarily accomplished through dedicated tests that are applied on a prototype developed for this purpose.
2. II.
3. Objectives of the Work
The main goal of this work is to propose a model that can simulate the electricity produced by photovoltaic panels to perform the test charge and discharge batteries that are provided in the power distribution system that supplies the electrical and electronic components installed on cubesat (CS).
Show the first results obtained through simulation of the main conditions of energy production that is performed by the photovoltaic panel's cubesat (CS) operating in orbit. The main function of the host computer (HC) is to hold the human-machine interface (HMI) at the application layer and to perform data communication with the source voltage (VS). To perform the simulation cycle of photovoltaic, the system user (USER) must preliminarily parameterizes the values related to the orbit of the operation cubesat (CS) which will be submitted when operating in the field of windows intended for this purpose.
4. III.
5. Architecture Simulation
The line data communication protocol with probability (LCP) is the physical medium that carries the transmission and reception of data between the card data communication computer host (HC) and command port of the voltage source (VS). This line is dedicated and provided with protection against electromagnetic interference.
The voltage source (VS) has means for receiving data and control signals sent by the humanmachine interface (HMI) in order to define a range with specific levels of voltage, which is a function of the characteristics for the supply of electrical current of the cells present in photovoltaic panel's cubesat (CS) [2].
The physical means that established the transport of energy equivalent to the amount generated by the photovoltaic panels for cubesat (CS) is the supply line of electricity (SLE). This line is dimensioned to operate with low Joule losses in the steady state, and with protection against electromagnetic disturbances and over current.
IV.
6. Computational Model
The computational model was designed to establish a curve relating the voltage and electric current similar to those that are generated by the photovoltaic panels on the operating condition in orbit cubesat (CS). The information contained in this curve are used to carry out remote parameterization of the voltage source (VS) in order to reproduce the characteristics of voltage and current in the supply line of electricity (SLE) of cubesat (CS).
Due to the cubesat (CS) considered in this work has no attitude control, solar panels will be installed on all sides to ensure that at least one face is exposed to solar electromagnetic waves. The maximum conversion of solar energy to electricity happens when the angle between the position of the sun planet and the panel photovoltaic cubesat (CS) is perpendicular. This way it was only considered one face to prepare the model presented in this work.
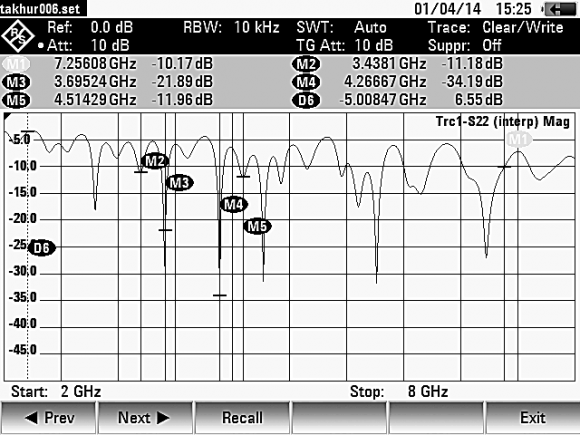
As shown in Figure 2, the model was developed to simulate the energy generated, with perpendicular incidence on one face of the photovoltaic panel provided for in cubesat (CS) in operating condition in orbit [3]. The value assigned to the variable resistance element (C9) is changed over time by the ramp generator (C13) with the goal of obtaining the current vs. voltage curve that is characteristic for the patterned array of photovoltaic cells. The result of the simulation model in question is shown in Figure 3.
7. Global Journal of Researches in Engineering ( ) F Volume XIV Issue
The values defined in the curve of Figure 3
8. Prototype
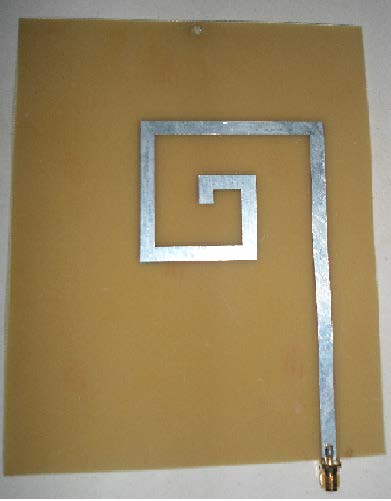
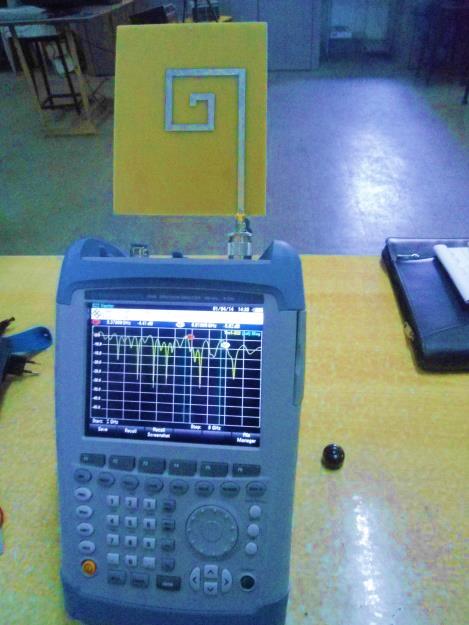
The prototype has been developed to validate the simulations discussed in this work and it is presented in Figure 4.
The set of nomenclatures, components and functions adopted for prototype are the same shown in architecture of the Figure 1. It is important to emphasize that observing the set of steps contained in the flowchart shown in Figure 5, the value stored in accumulator that performs the orbital cycle count is related to the amount of times that occur charge and discharge cycle that the batteries are subjected in orbit operation. This number of cycles is considered as the main reference in the degradation of battery life.
9. a) Graphic Interface
Through the graphical interface the system user (USER) parameterizes the values that are required to perform the simulation of the orbit, the command initiation of testing and monitoring of results through remote resources.
Figure 6 presents the window parameterization which was developed with existing resources of an integrated development environment [5], dedicated to this purpose. There are virtual components that allow the system user (USER) command, view and parameterize information related to: i. P1 (Switch General) -enables the power terminal of the supply line of electricity (LSE).
ii. P2 (enable orbit) -enables time base to playback periods of eclipse, lighted related to orbit operation. iii. P3 (with VISA) -the communication port of the host computer (VS) that will be used in the transfer of data for the voltage source (VS). iv. P4 (time Illuminated) -defines the time the cubesat (CS) will receive solar radiation.
v. P5 (time Eclipse) -defines the time the cubesat (CS) will be in the shadow of the Earth. vi. P6 (Isc) -the value for the maximum short circuit current that will be provided by the array of photovoltaic cells. vii. P7 (Output Current) -display of the current value of current drawn by cubesat (CS).
viii. P8 (voltage output) -display the current value of the applied voltage electrical system cubesat (CS). The trend graphs of the voltage and current applied to the electric system of the cubesat (CS), during the time of testing are presented by virtual components contained in the monitoring window, which is shown in Figure 7.
10. Global
11. b) Operational Tests
The validation of the components contained in the windows of graphical interfaces was made adopting the following structure: i. Set the voltage source (VS) to communicate with human-machine interface (HMI) that is installed on the host computer (CH).
ii. A program was developed to perform the steps contained in the analytical flowchart shown in Figure 5.
iii. The layout of virtual components contained in the windows of the graphical interfaces shown in Figure 6 and Figure 7 was adopted.
The tests were performed evaluating all the graphics contained in the windows of graphical interfaces for various times. In this context, the phase parameter is the preliminary condition necessary to perform the activation key insertion (I1) within the window that enables the simulation of the operation of the photovoltaic panel cubesat (CS) in orbit operation.
The prototype made correct simulations of batteries cubesat (CS) charging and discharging in accordance with the program management simulator that performs the steps contained in the analytical flowchart shown in Figure 5.
VI.
12. Conclusion
The positive results observed in tests performed with the prototype suggest that the method used to simulate the operation of the photovoltaic panel is suitable for reproducing the operating conditions of the orbiting cubesat (CS).
The goals established in this study were affected, mainly in what is related to model development and implementation of computer simulation to determine the electrical characteristics of operation of photovoltaic cells, and thus determine the voltage curve versus electric current that is required to validate the mentioned model.
The strategy used in this work to determine the curve of voltage versus current electrical and subsequently perform validation through prototype testing is consistent to reproduce the characteristics of photovoltaic cells that are installed in panels that convert solar energy to electricity in CubeSats.
VII.