1. Introduction
ood transportation system plays a vital role in the overall development of a nation's economy particularly in an urban context. The persistent inadequacy of mass transport facilities in the urban areas has forced individuals to use personalized modes. As a result, there is increased growth of vehicles, especially two wheelers and cars in Indian roads. The existing road network is inadequate and deficient to accommodate the growing vehicular population. This leads to congestion, delay and concomitant pollution of all sorts.
Public transport in India can be into two major modes: rail and road. Out of the country's total passenger movement, 80 percent is met by road transport while remaining 20 percent is carried by railways (Kaushik Deb 2002). These calls for urgent measures and an effective way to address this problem. Thus it is necessary to encourage greater use of public transport especially rail transport instead of personalized vehicles. This can be achieved through Transit Oriented Land Use Development (TOD).
2. II.
3. Land use Transport Interaction
Conventional transport planning involves assessment of travel demand for given set of land use development and prediction for an anticipated set of land use developments. In practice due to high capital costs, neither the projects identified to cater future rail transport demand have been executed, nor the land use developments has occurred as anticipated. One of the main reasons for such failure is lack of proper appreciation of landuse transport interaction (Kumaravelu 2001). Since landuse and transport systems are more dynamic, it is imperative that the land use -transport model needs to be developed to represent dynamic behavior both with its interaction in the urban area.
4. III.
5. Need for the Study
Urbanization is a perpetual process. Due to urbanization, the kind of development taking place in most of the Indian cities is in an unplanned manner. Huge influx of population from rural to urban areas in terms of social increase and its natural growth have induced greater demand for travel. The population and vehicular population in Indian cities are increasing alarmingly but the road networks in these cities had not been planned to carry the present day traffic. The area occupied by roads and streets in class -I cities in India is only 16.10 percent of the total developed area while the corresponding figure for the USA is 28.19 percent. Apart from this, the inadequate civic and transport infrastructure results in traffic congestion and deterioration of urban environment.
In a paper (Arrington Parsons Brinckerhoff 2004) on "Light Rail Transit and Transit Oriented Development" presented an overview of elements of a successful integrated LRT and TOD strategy. Designing development oriented transit and achieving supportive public policy were examined. He even said that "built it and they will come" is a theory i.e. "Building transit first, in the hope development will follow". A successful TOD reinforces both the community and the transit system. At an individual station TOD can increase ridership by 20% to 40% and upto 5% overall at the regional level.
It is estimated that the rail based system will be required in Cities with population more than 2 million and are generally expected to have transport corridors with maximum demand upto 20,000 peak hour peak direction trips (phpdt) (Vinod Sibal and Yash Sachdeva 2001). There is a need to encourage the use of public transport system especially rail transit mode to achieve sustainable development in the long run. Hence an attempt is made in this present research work to study the land use changes, travel patterns along the corridor and to study the operational characteristics and utilization of existing railway line and bus services.
6. IV.
7. Objectives of the Study
Keeping in view of the necessity of Transit Oriented Development, the objectives of this study have been framed as follows:
? To study the past and present use of land along the rail corridor to detect the changes in land use in order to plan for its optimal use.
? To study the operation of both rail and bus transportation system and understand the existing level of utilization.
? To understand and appreciate the characteristics of the user groups of both rail and bus systems and characteristics of households settled along transit corridor.
? To develop a System Dynamic Simulation model for encouraging Transit Oriented Land Use Development.
? To evaluate relevant policy options relating to land use and transport integration towards optimal utilisation of public transport especially rail, to achieve sustainable development in the long run.
V.
8. Study Methodology
The study methodology is shown in Figure 1. It involves study on Land use changes for various periods using Remote Sensing Analysis and building of System Dynamics Model for various scenario options:
9. Identification and Delineation of Study Area
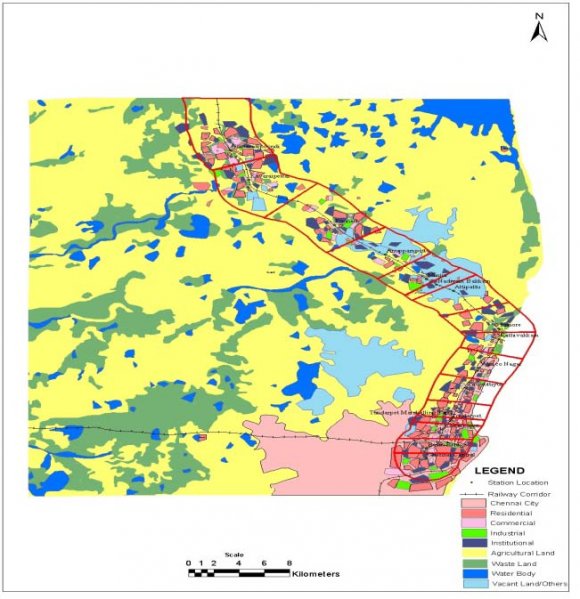
Chennai Central to Gummidipoondi Corridor has been identified as low patronage one compare to other suburban corridors. The Table 1 gives the characteristics of various stations in suburban corridor.
The influence area of stations was assessed based on a survey of boarding passengers. The questionnaire survey has been conducted during the morning and evening peak hours. The walking distance of passengers was one of the criteria chosen to delineate influence areas. The line up to Chennai City and CMA are taken as segment I and segment II. The analysis of the survey data showed that the majority of originating points and destination points are within 1.00km by walk and 2.50km by walk and other personalised and paratransit modes.
10. VII.
11. Land use Change Detection
A spatial methodology was used for land use change detection. It involved four steps, namely Preparation of land use map, Digitization of land use maps, Integration of classified land use maps, Analysis of land use changes during 1986 to 1996 and 1996 to 2006 and Analysis of land use development along railway line at a distance of 0.50 km, 1.00 km and 2.50 km. These steps are shown in Figure 5.32 and discussed in the following sections. Data used for the land use analysis are namely , Panchromatic Aerial Photograph (1986 on 1: 50,000 scale), Satellite data IRS-1C (1996 on 1:50,000 scale) and Satellite data IRS-P6, and LISS III digital data (2006) were acquired. The survey of India toposheets on 1:50,000 scale were used as a reference data.
12. VIII.
13. Preparation of Land use Map
Base map on 1:50,000 scale was prepared from the Survey of India toposheets on the same scale. After scanning all imageries, land use classification was prepared. Land use map was prepared by Digital Image Processing method using Erdas Imagine 8.7 Software. From the analysis, it is observed that most of the agricultural, water bodies, vacant land and waste lands are converted to residential areas due to the pressure of urbanization. The area enclosed near rail corridor is very densely populated. The urban sprawl is extending heavily to the Northern side along the Chennai Central to Gummidipoondi suburban rail corridor. Source: Study Analysis
The decennial trend of land use is shown in Table 2 for three time periods. It is obtained that the existing activity pattern in study area in segment I indicate a development which is constrained due to congestion, excess use of infrastructure facilities and lack of vacant land. Since the area is densely developed, it offers limited scope for further intensification, only densification is possible with increased FSI, depending on the infrastructure availability in the stretch. Whereas in segment II area along the corridor, there is a scope for inducing both accelerating development and densification is possible due to availability of vacant lands.
14. c) Buffer Analysis
The existing land use characteristics in the year 2006, are analysed with multiple buffers along rail stations. In this case three buffers have been created with a radius of 0.50 km, 1.00 km and 2.50 km taking rail stations as the center. The land use details are tabulated in Table 3 which indicates the less proportion of land use mix in first buffer when compared to other two. The corridor passes through industrial and residential area. Within the City, the area has less vacant land, it offers limited scope for densification, only infill and intensification are possible. In this corridor one side is covered by sea and this also reduces developments along this corridor. Whereas in the Chennai Metropolitan Area and outside the CMA area there is scope for accelerated development and intensification and for inducing densification since this area has more vacant and agricultural lands.
15. Source: Study Analysis
For this project the area within an influence distance of different buffers has to be calculated station area wise. To calculate this area a buffer has to be created around the railway line for the respective distances. Creation of buffer is a type of proximity analysis in GIS. The buffer actually overlaid on the land use map. Hence, the land use map is given as the first input followed by the buffer and the developments.
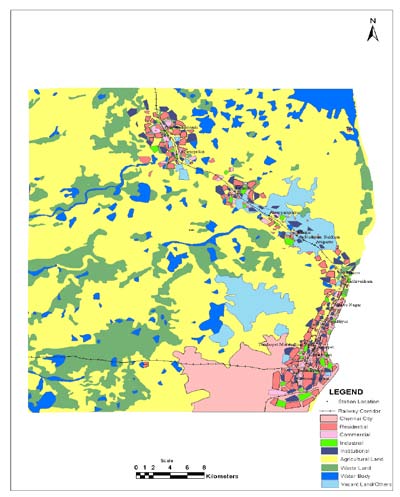
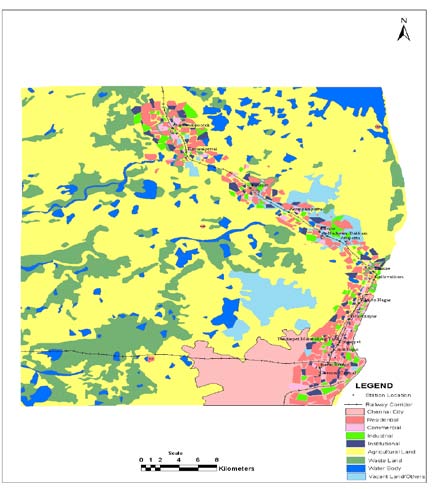
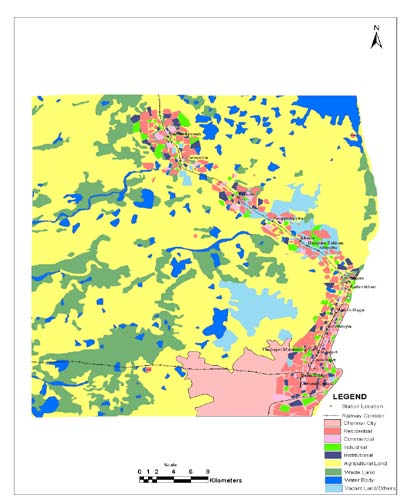
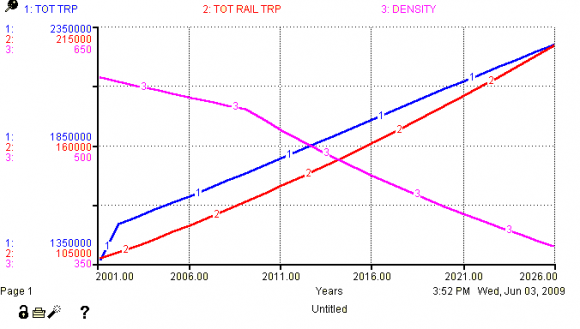
The buffer theme is created with multiple buffers around the rail stations. In this case three buffers have been created with a radius of 0.50 km, 1.00 km and 2.50 km taking the rail station as the center. The land use maps are presented in fig. 2, fig. 3 and fig. 4 The land use areas taken as inputs for developing models. The land use maps are given in Figures 5.36, 5.37 and 5.38. It is observed that up to 1.00 km density is high; beyond that it is less. Chennai city is denser than outer city limit. The industries occupy nearby station area within city and outer city is sparsely developed, without adequate infrastructure facilities, discourage the rail user.
Study of the existing pattern of land use of study area clearly shows that developments have mainly occurred along railway stations with mixed land uses due to improper planning. Commercial areas have developed mainly along road leading to railway station and around market. Industrial uses have come up near railway line in segment I. Water bodies, vacant land, Waste land and Agriculture occupies major portion of the land. Existing land use reveals that urban sprawl occur due to the absence of any comprehensive planned development. In study corridor, it is observed that maximum passenger trips hourly variation is 3800. Directional patronage clearly indicates that towards Gummidipoondi traffic is heavy during morning hours. The directional split during the morning period is 64:36. Morning passenger trip is 15426 and evening passenger trips is 14560. This justifies that the evening passenger trips are return trips. Peak period is observed between 7:00 AM and 9:00 AM in the morning and the evening peak between 5:00 PM and 7:00 PM. The suburban stations are classified into four major categories based on the number of passengers handled per day which ranges from 2,000 to 10,000 passengers.
16. b) Train Passenger loading analysis
From the total number of trips handled per day at different stations during the year 2003-04, it has been observed that the number of trips handled at Chennai Central is maximum and Basin Bridge handled at minimum. In this corridor, Industries are clustered around railway stations, Residential and Commercial locations are found close to National Highways not close to railways.
For Chennai Central-Gummidipoondi, station to station passenger loading and section wise passenger loading is analyzed. It is found that 11.85 million commuters have traveled in 2003-04. On an average 0.66 lakhs of commuters travel in a day within the corridor Chennai Central -Gummidipoondi but approximately station wise boarding and alighting passengers per day is 1.08 lakhs. From that, it is found that other corridor passenger using this corridor. Hence it is clear that inter corridor traveling also prevails to certain extent.
17. X.
18. Analysis and Model Development
The model of the Population, Land Use and Transport interaction using the System Dynamics (SD) approach has been implemented in the 'STELLA' environment ('STELLA 8.1' package). The modeling tool which is an object-oriented simulation environment allows the development of Transport Energy interaction models with significantly less effort than using traditional programming languages. It has a user-friendly graphical interface and supports modular program development. Using this tool, the modeller defines objects representing physical or conceptual system components and indicates the functional relationships among these objects. Building on these strengths, the general architecture of the present work is framed.
19. a) Phases of Model Building Process
Generally the model building process can be divided into two phases namely the Conceptual phase and the Technical phase. It is the process of defining a problem out of a situation, developing various relationships quantitatively, testing the model with several policy options and analysing the behaviour of the model.
The first phase in the model building process involves recognizing and defining a problem. Important properties of dynamic problems are that they contain quantities that vary over time. System Conceptualization phase involves committing to paper the important influences believed to be operating within the system. Systems may be represented on paper in several fashions and the three most common being causal-loop diagram, plots of variables against time and computer flow diagrams. In model representation Phase, models are represented in the form of computer code that can be fed into the computer, that is in the form of computer programming languages. Under model behavior phase, simulation is carried out in this phase to determine how all the variables within the system behave over a period of time.
In model validation stage numerous tests must be performed on the model to evaluate its quality and validity. These tests range from checking for logical consistency, to matching model output against observed data collected over time for validating the model and to more formal statistical significance of the parameters used within the simulation process. Policy analysis and model use is the final phase, here the model is used to test alternative policies that might be implemented in the system under study. This phase of the model building process is perhaps the most difficult.
20. b) Building Blocks of Model
The System Dynamics tool used in this study to model population, land use and transport interaction has four basic building blocks as listed below.
21. ? Stock
Stocks or levels are used to represent anything that accumulates. An example of stock would be population level at one time.
22. ? Flows
Flows or rates represent activities that increase and decrease stocks. An example of flow includes birth rate and death rate.
23. ? Connectors
Connectors are used to establish the relationship among variables in the model. The software represents them graphically as arrows. They carry information, which can be a quantity, constants, an algebraic relationship or a graphical relationship.
24. ? Converters
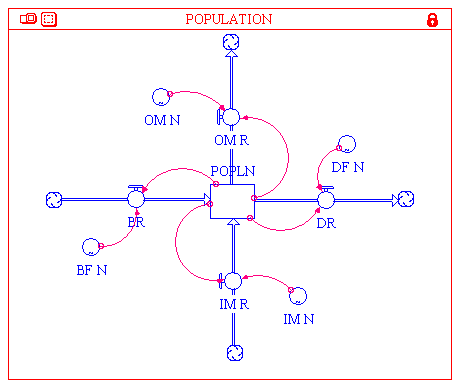
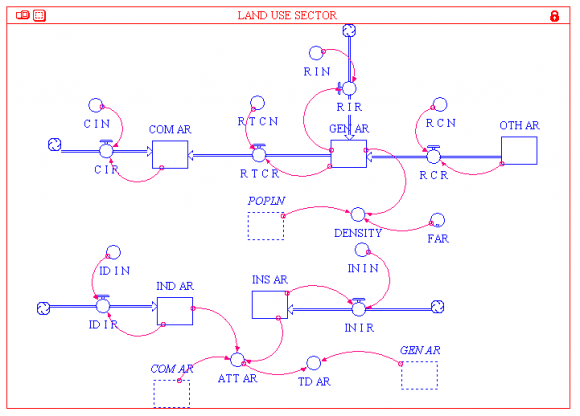
Converters transform input to output. Converters can accept input in the form of algebraic relationships, graphs and Tables. For ease of presentation, the symbols used for flow diagramming of System Dynamics are presented in the Figure 8 The landuse sector is illustrated in Figure 3; it is used to simulate the changes in the various landuses. From the past present landuse data collected, the rate of change of land uses have been determined. Landuse conversions from other land area (OTH AR) to rip generating residential land area (GEN AR), from trip generating land area to commercial area (COM AR) was determined and projected. From the GEN AR, FAR and Population projected from the population sector, the Density is calculated. All areas other than GEN AR and OTH AR are considered to be Trip Attracting Areas (ATT AR). The total developed area (TD AR) is sum of ATT AR and GEN AR.
25. Land Use Model e) Transport Sector
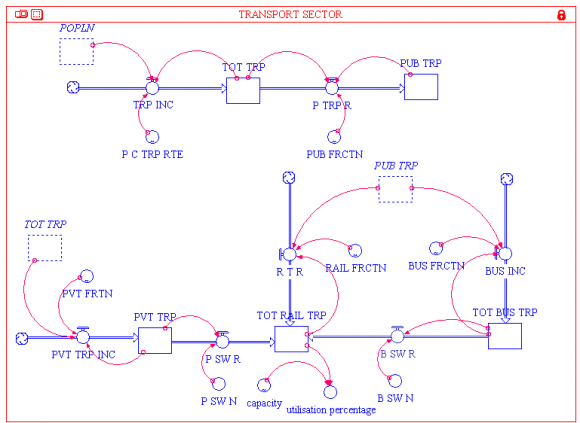
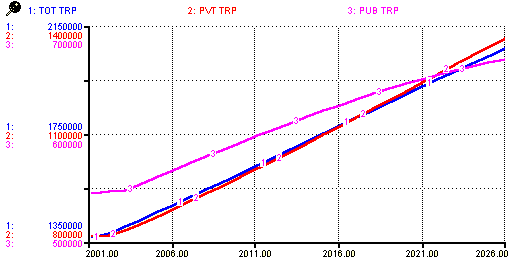
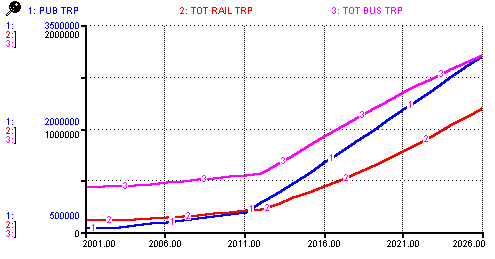
In order to evaluate the trip production, transport sector (Figure 4) is considered in the study. The public transport system in the study area comprises of both road and rail facilities. The objective of the land use transport model is to bring sustainable land use development through rail transit ridership. Therefore, the model is tested for various policies to obtain an optimum land use and transport facilities. Switchover of passengers from personal modes (PVT TRP) and bus (TOT BUS TRP) to rail (TOT RAIL TRP) is considered. The public and personal modal trips are calculated from the total trips (TOT TRP) using respective model fractions from (PUB TRP) the public transport trip the bus and rail trips are derived. The simulation values in segment I is given in Table 3. Source: Primary Analysis
26. Conclusions
The following conclusions are drawn from this study based on the model analysis carried out in Northern suburban rail corridor:
? It is observed that maximum distance to reach nearby station is 1.00 km by walk and 2.50km by personalised and para transit modes.
? The analysis shows that there is an increase in ridership of suburban service due to the shift from bus and personalized modes if the rail transit system capacity is augmented.
? It is observed that by providing increased frequency, reduction in fare, Inter-modal transfer facilities, common ticket system, increasing accessibility and capacity; the number of rail transit users can be increased.
? Present development along the corridor does not increase patronage much because of scattered and unplanned developments which discourage the rail users. Hence, densification / TOD is proposed to attract more passengers along this corridor.
? The present design capacity of the northern suburban railway corridor is 285120 passengers per day. In design capacity, the utilized capacity was only 37 percent in minimum headway of 15 minutes. Hence, the corridor is highly under-utilized.
27. XII.
Results of Segment i
? In segment I for simulation I, the increase of population is only 13,02,305 lakhs along the rail corridor. In simulation II, the increase of population is 21,73,690 lakhs, which is in the order of 1.67 times more than that of simulation I due to partial improvement and in simulation III, the population increase is more than 2.21 times than that of simulation I due to maximum improvement.
? In segment I, under simulation I, the density increases to 338 persons / ha., which is high. In simulation II, the density decreases to 282 persons per ha., and in Simulation III it is 280, which are acceptable.
? The rail transit share in simulation II is 2.89 times more than Simulation I in segment I, this is due to increasing the FSI and augmenting the rail transit operations partially, in the simulation analysis.
? The rail transit share is 6.08 times more in simulation III than Simulation I in segment I, due to not only increasing the FSI but also augmenting the rail transit operations due to maximum improvement.
XIII.
28. Results of Segment ii
? In segment II, simulation I, the increase of population is only 11,18,141 lakhs along the rail corridor. In simulation II, the increase of population is 24,97,246 lakhs, which is in the order of 2.23 times more than that of simulation I due to partial improvement and . In simulation III, the population increase is more than 3.15 times than that if simulation I due to maximum improvement.
? The rail transit share in simulation II is 3.65 times more than Simulation I in segment II, due to not only increasing the FSI but also augmenting the rail transit operations partially.
? The rail transit share in simulation III is 8.12 times more than Simulation I in segment II, this is by increasing the FSI and augmenting the rail transit operations due to maximum improvement.
? In the simulation III, it is seen that by increasing the FSI, modal share, addition of new lines and switchover rate, the maximum capacity of suburban rail corridor could be utilized. ? Hence, the possibility of land use development in segment I needs densification and segment II area requires accelerated development and densification to enhance the patronage of the present suburban system with increase frequency and capacity, also addition of new rail line.
XIV.
29. Recommendations
? Population increase always increases the growth of public transport and personalized vehicles, but the present road system is beyond endurance. It emphasis the need for TOD along the corridor.
? TOD would enhance the Public Transport users and consequently discourage the personalised vehicle users for ensuring sustainable environment.
? Planned and orderly TOD development would also promote sustainable transport development.
? Allowing higher FSI from 1.50 to 4.00 along the study corridor would justify TOD.
? Providing incentives for developers to promote land use in the proposed stretch, or some sort of policy decisions are needed from Government side to attract the settlement of the people.
Since, rail transit has a number of advantages of its own namely, decrease in environmental pollution, saving travel time, minimized energy consumption, cost effective, it should be encouraged to its maximum extent to ensure standard of living and achieve sustainable transport developments in the long run.


| Sl. No. | Name of stations | Distance in km | Inter-station distance in km | |||
| 1 | Chennai central | 0.00 | 0.00 | |||
| 2 | Basin Bridge | 2.22 | 2.22 | |||
| 3 | Korukkupet | 2.93 | 0.71 | |||
| 4 | Tondiarpet | 4.08 | 1.15 | |||
| 5 | Tondiarpet Marshalling Yard | 5.73 | 1.65 | |||
| 6 | Tiruvottiyur | 7.81 | 2.08 | |||
| 7 | Wimco Nagar | 10.31 | 2.5 | |||
| 8 | Kathivakkam | 13.33 | 3.02 | |||
| 9 | Ennore | 14.88 | 1.55 | |||
| 10 | Attipattu Pudunagar | 19.1 | 4.22 | |||
| 11 | Nandiyambakkam | 20.88 | 1.78 | |||
| 12 | Attipattu | 22.16 | 1.28 | |||
| 13 | Minjur | 24.78 | 2.62 | |||
| 14 | Anuppampattu | 28.79 | 4.01 | |||
| 15 | Ponneri | 33.48 | 4.69 | |||
| 16 | Kavaraipettai | 40.16 | 6.68 | |||
| 17 | Gummidipoondi | 46.08 | 5.92 | |||
| Source: Southern Railways | ||||||
| Supervised classification was applied to derive | ||||||
| the landform in the study area. The classification was | ||||||
| residential, | commercial, | institutional, | industrial, | |||
| agricultural, waste land, water bodies, vacant land and | ||||||
| others. Based on this category, land use maps were | ||||||
| prepared through visual interpretation of imageries. | ||||||
| Land Use | Area | Percentage of | Area | Percentage of | Area | Percentage of |
| Category | (sq.km.) | CMA | (sq.km.) | CMA | (Sq.km.) | CMA |
| Year | 1986 | 1996 | 2006 | |||
| Residential | 29.64 | 11.62 | 42.60 | 16.71 | 53.55 | 21.00 |
| Commercial | 4.97 | 1.95 | 5.32 | 2.09 | 6.51 | 2.55 |
| Institutional | 6.59 | 2.58 | 7.47 | 2.93 | 8.72 | 3.42 |
| Industrial | 14.33 | 5.62 | 15.86 | 6.22 | 18.16 | 7.12 |
| Waste land | 16.72 | 6.56 | 17.02 | 6.67 | 15.33 | 6.01 |
| Water bodies | 22.68 | 8.89 | 20.67 | 8.11 | 17.06 | 6.69 |
| Agriculture | 136.81 | 53.65 | 124.11 | 48.67 | 119.29 | 46.78 |
| Vacant land | 16.72 | 6.56 | 14.45 | 5.67 | 7.96 | 3.12 |
| Others | 6.54 | 2.56 | 7.51 | 2.95 | 8.43 | 3.31 |
| Total | 255.00 | 100.00 | 255.01 | 100.00 | 255.01 | 100.00 |
| Land Use | Area | Percentage of | Area | Percentage of | Area | Percentage of |
| Category | (sq.km.) | CMA | (sq.km.) | CMA | (sq.km.) | CMA |
| Radius in Buffer | 0.50 km | 1.00 km | 2.50 km | |||
| Residential | 11.97 | 25.47 | 26.67 | 27.78 | 53.55 | 21.00 |
| Commercial | 2.46 | 5.23 | 4.85 | 5.05 | 6.51 | 2.55 |
| Institutional | 3.02 | 6.43 | 5.63 | 5.86 | 8.72 | 3.42 |
| Industrial | 7.56 | 16.09 | 12.51 | 13.03 | 18.16 | 7.12 |
| Waste land | 1.73 | 3.68 | 4.30 | 4.48 | 15.33 | 6.01 |
| Water bodies | 3.12 | 6.64 | 5.45 | 5.68 | 17.06 | 6.69 |
| Agriculture | 12.17 | 25.89 | 26.64 | 27.75 | 119.29 | 46.78 |
| Vacant land | 2.52 | 5.36 | 4.47 | 4.66 | 7.96 | 3.12 |
| Others | 2.45 | 5.21 | 5.48 | 5.71 | 8.43 | 3.31 |
| 47.00 | 100.00 | 96.00 | 100.00 | 255.00 | 100.00 | |
| Level Variable | Auxiliary Variable |
| Dummy Level Variable | Rate Variable |
| Constant | Physical Flow |
| Source / Sink |
| Density | Public | |||||
| Simulation | Population | (persons/ ha.) | Total trips | Rail trips | Bus trips | transport |
| trips | ||||||
| Simulation I (Do Minimum) | 13,02,305 | 338 | 20,69,098 | 1,98,350 | 5,83,180 | 6,69,986 |
| Simulation II (By | ||||||
| increasing FSI 1.5-3.00 | 21,73,690 | 282 | 35,00,638 | 5,72,826 | 12,30,887 | 18,55,089 |
| and rail operations) | ||||||
| Simulation III (By | ||||||
| increasing FSI 1.5-4.00, rail operations and | 28,74,338 | 280 | 46,04,386 | 12,06,008 | 17,20,278 | 30,65,982 |
| addition of new lines) |
| Density | Public | |||||
| Simulation | Population | (persons/ | Total trips | Rail trips Bus trips | transport | |
| ha.) | trips | |||||
| Simulation I (Do Minimum) | 11,18,141 | 107 | 16,92,165 | 1,41,735 | 3,98,676 | 5,21,391 |
| Simulation II (By | ||||||
| increasing FSI 1.5-3.00 | 24,97,246 | 197 | 37,45,382 | 5,17,378 | 11,59,746 | 18,50,967 |
| and rail operations) | ||||||
| Simulation III (By | ||||||
| increasing FSI 1.5-4.00, rail operations and | 35,18,785 | 208 | 52,21,294 | 11,51,717 | 17,06,253 | 32,26,697 |
| addition of new lines ) | ||||||
| Source: Primary Analysis | ||||||