1. I. Introduction
p to the present, the limit equilibrium method (LEM) is still the most popular method as used by engineers and researchers for slope stability analysis. In general, LEM can be classified under two major groups: "simplified" methods and "rigorous" methods. Traditionally, the LEM is taken to be a statically indeterminate problem, and assumptions on the distributions of internal forces are required for the solution of the factor of safety (Cheng and Lau 2014). Various methods of analysis are adopted for various engineering applications, and the Spencer method appears to be the most popular at present. Cheng et al. (2010), Cheng et al. (2011) and Cheng et al. (2013) have pointed out that if the concept of extrema (extremum principle or equivalently numerical variational principle) or the ultimate state is considered, then there will be sufficient condition to solve a slope stability problem without the use of internal force distribution function or any other arbitrary assumption, and the LEM will become a statistically determinate problem. Furthermore, Cheng et al. (2010) have also found that the convergence problem using the Spencer method may affect the determination of the lowest factor of safety and the location of critical failure surface. Cheng et al. (2010) Cheng et al. (2011) and Cheng et al. (2013) have however also pointed out that for normal problems, the extrema will be close to the classical solutions by Spencer so that the determination of the extrema is necessary only for complicated problems. The power of the LEM is finally illustrated by the equivalence between the bearing capacity, lateral earth pressure and slope stability problems. The extremum from the LEM is equivalent to the results from plasticity solutions, and the results from the LEM can be a good approximation of the solution of a general geotechnical problem.
The strength reduction method (SRM), implemented through the finite element method, was applied for slope stability analysis as early as 1975 by Zienkiewicz et al. Later the SRM was applied by Naylor (1982), Donald and Giam (1988), Matsui and San (1992), Ugai and Leshchinsky (1995), Dawson et al. (1999), Griffiths and Lane (1999), Zheng et al. (2005), Cheng et al. (2007a), Wei et al.(2009), Cheng (2009a, 2009b), Wei and Cheng (2010) and Nian et al. (2012). More recently, the SRM was implemented by other numerical procedures such as the mesh-free method (MFM) and the spectral-element method (SEM) (Tiwari, 2015). SRM technique has also been implemented into several commercial geotechnical finite element programs for engineering applications. A detailed discussion and study about the use of SRM in slope stability analysis has been given by Cheng et al. (2007a). Various problems including sensitivity to mesh design, size of solution domain, dilation angle, numerical instability with different SRM computer programs have been identified by Cheng et al. (2007a), and some program developers have updated their programs in accordance with the identified problems.
Griffiths and Lane (1999 2015) compared LEM, SRM and limit analysis methods, and showed that for steep slopes with low factors of safety, the flow rule may have a significant influence on the comparisons, while numerical instabilities may occur in the case of nonassociated plasticity with large differences between the friction angle and dilation angle. Tshuchnigg et al (2015b) further investigated this phenomenon and proposed various approaches, based on the work on plasticity by Davis (1968), to overcome such obstacle.
)Shen and Karakus (2014) and Zhao et al. (2015) implemented the SRM with nonlinear failure criteria to study rock and soil slope stability, respectively, but they adopted different 'strength reduction strategies', and Zhao et al. (2015) concluded that the factors of safety obtained by SRM will be substantially influenced by these strategies, i.e., whether the 'cohesive' and 'stressdependent' components of shear strength are factored separately or simultaneously in the SRM analyses.
Limit analysis does not require the interslice force function and is free of convergence problem which are unavoidable for the classical limit equilibrium method (except for the extremum principle by ). It has the advantages similar to the LEM in that no constitutive model and initial conditions are required, a flow rule is however required to specified which is usually not critical towards the factor of safety (similar to the interslice force function). For limit analysis, the upper bound approach is the more popular approach, and recently some commercial programs are available for the limit analysis of the stability geotechnical problems. The equivalency between limit analysis and LEM has been demonstrated by Leshchinsky et al. (1985). It is usually considered that the LEM methods cannot satisfy all of the equilibrium requirements. This understanding is true for the classical LEM, but has been demonstrated to be not true with the extremum principle by Cheng et al. (2010), Cheng et al. (2011) and Cheng et al. (2013). The uses of limit analysis for simple geotechnical stability problems have been discussed by Chen (1975), but such analytical approach is not practical for real problems with complex geometry and soil/geologic conditions.
For limit analysis, a new approach called the discontinuity layout optimization method (DLO) has attracted the attention of some engineers and researchers. DLO procedure expresses the limit analysis problem entirely in terms of lines of discontinuity instead of elements as in the classical continuum problem (Smith and Gilbert 2007). Using DLO, a large number of potential discontinuities are set up at different orientations; while the continuum based element formulations, discontinuities are typically restricted to lie only at the edges of elements. With the use of modern optimization algorithms, an optimized solution can be achieved easily. After the initial success by Smith and Gilbert (2007), there are different works in DLO by Clarke et al. (2013), Smith and Gilbert (2013), Bauer and Lackner (2015), Al-Defae and Knappett (2015), Leshchinsky (2015), Vahedifard et al. (2014), Leshchinsky and Ambauen (2015). The original DLO formulation suffers from the limitation that only the translation mechanism can be considered. In view of such limitation, Gilbert et al. (2010) and later Smithy and have extended the DLO formulation to cover the rotational formulation. Since DLO is actually a numerical form of limit analysis, the basic limitation of limit analysis is similar to that for DLO. a) Some Case Studies with LEM and DLO Yu et al. (1998) have given a very detailed comparison between the use of limit analysis and LEM, and it is found that the results from the two methods are similar and comparable in most cases for relatively simple problems. Recently, DLO has been adopted for slope stability analysis by Leshchinsky and Ambauen (2015), and it is found that the results by DLO and LEM are comparable in general. Leshchinsky and Ambauen (2015) have however found some cases for which there are noticeable differences between the DLO and LEM, and they have concluded that DLO requires less assumption on the location of collapse, and therefore may be more preferable than LEM, especially for complex, yet realistic geotechnical problems. After reviewing the examples by Leshchinsky and Ambauen (2015), the authors tend to disagree with the results and comments by Leshchinsky and Ambauen (2015). There are some limitations in the works by Leshchinsky and Ambauen (2015) which include: 1) use of classical LEM method which are greatly affected by convergence problem (Cheng et al. 2008); 2) critical failure surface has not been determined (Fig. 12 from Leshchinsky and Ambauen 2015 has only considered 151 surfaces); 3) interslice force function can be critical in complex problems. As discussed by Cheng (2003) 2013) have overcome these problems and can provide solutions similar to some classical plasticity problems which are not possible with the classical LEM. A fair comparison and commentary on these methods must be based on reliable and robust analyses that identify the differences between DLO and LEM. Some problems with the DLO have been previously identified by Cheng (2018), and more studies will be carried out in this paper.
With reference to Fig. 1 which is Fig. 5a by Leshchinsky and Ambauen (2015), the soil parameters are unit weight=19 kN/m3, c'=28 kPa and ?'=20°. The critical result by DLO pass below the toe of the slope at the right hand side of Fig. 1 by Leshchinsky and Ambauen (2015). On the other hand, the critical result by the authors using the heuristic optimization method and Spencer method developed by Cheng et al. (2007a) and Cheng and Lau (2014) pass through the toe of the slope. The critical result by Baker (1980) also pass through the toe of the slope while the critical result by Krahn and Fredlund (1997) (not shown for clarity) is similar to that by DLO but extends further to the right of the toe. The result by Krahn and Fredlund (1997) is not determined by the use of advanced optimization algorithm, and the adequacy of the result has not been confirmed. The authors have tried several updated commercial programs and have obtained results similar to that by the authors as shown in Fig. 1. Since the friction angle of the soil is 20° which is not a small value, the critical result by limit analysis will pass through the toe of slope as demonstrated by Chen (1975) using limit analysis. In views of the above discussion, the authors will suggest that the results by DLO cannot give the critical solution for such a simple case which is surprising to the authors. With reference to Fig. 2 where there is a 0.5m thickness of soft material for soil layer 2, the soil parameters are unit weight=19 kN/m 3 , c'=28 kPa and ?'=20° for layer 1 and unit weight=19 kN/m 3 , c'=0 kPa and ?'=10° for soil layer 2. The results by DLO and the (2015), Baker (1980), and Krahn and Fredlund (1997). When the authors increase the thickness of the soft layer to 1.5m, the critical result will still lie at the bottom of the soft layer with a factor of safety 1.14. Since the shear strength parameters at soil layer 2 are low, the weight of the soil tends to push the soft material to the right so that the critical slip surface should lie within the soft band, and the results by the authors are more reasonable as compared with other results. As discussed by Cheng (2007) and Cheng et al. (2012), the presence of a soft band is mathematically equivalent to a Dirac function, for which many optimization algorithms fail to work. The domain transformation technique by Cheng (2007) and the coupled optimization algorithm by Cheng et al. (2012) have effectively overcome this problem without any special precaution required by the engineers in the analysis. In Fig. 3 which is same as that for Fig. 2 with a pore pressure ratio 0.25 (Fig. 5d by Leshchinsky and Ambauen, 2015), the critical result by Leshchinsky and Ambauen (2015) lies at the top of the soft band while the critical results by the authors, Baker (1980), and Krahn and Fredlund (1997) (mistaken to be at the top of the soft band by Leshchinsky and Ambauen 2015) lie at the bottom of the soft band, and the inability to locate the critical result for a soft band by DLO is clearly illustrated. In Fig. 4 which is same as that for Fig. 2 with a prescribed water table (Fig. 5f In Fig. 5 (Fig. 12 by Leshchinsky and Ambauen, 2015), there are great differences between the critical result by the authors and Leshchinsky and Ambauen (2015). The soil parameters are unit weight=20 kN/m 3 , c'=0 kPa and ?'=30° for soil layer 1, unit weight=19 kN/m 3 , c'=0 kPa and ?'=45° for soil layer 2 and unit weight=19 kN/m 3 , c'=10 kPa and ?'=0° for soil layer 3.
On the left hand side of the critical slip surface by Leshchinsky and Ambauen (2015), there is a very sudden change in the slope of the critical failure surface which seems unlikely to happen. At the right hand side of the critical slip surface by Leshchinsky and Ambauen (2015), the critical slip surface is nearly vertical, which is also highly unlikely, as the friction angle of soil layer 1 and 2 are 30° and 40° respectively with zero cohesive strength. When this same slip surface by Leshchinsky and Ambauen (2015) is considered with the M-P method using f(x)=sin(x), the authors actually get a factor of safety of 1.05, which is significantly greater than the result of 0.95 by Leshchinsky and Ambauen (2015).
This problem is then reanalyzed by the authors using LEM to locate the critical slip surface. For this problem, the use of f(x)=1 is poor in convergence, and the authors get a slightly different critical slip surface and a factor of safety of 0.97 by using f(x)=1.0. As mentioned by Cheng et al. (2008Cheng et al. ( , 2010)), f(x) can be critical in some cases which will affect the optimized solution. In this respect, the authors have also adopted the extremum principle (Cheng et The authors have adopted an accuracy of 0.001 in all the global optimization search in the present study, and the global minima of each example has been tested with different optimization algorithms for confirmation. Based on the above case studies, it can be concluded that some of the past reported results in literature which are not optimized with the modern optimization algorithms may not be reliable enough for comparisons. In particular, for the presence of a soft band which is a difficult problem, the present study and the works by Cheng (2007), Cheng et al. (2012) have demonstrated that great care must be taken in order to obtain a good result. Furthermore, as a relatively new computational method, DLO has been demonstrated to be affected by the soft band or local minima problem. Overall, the authors view that the problems presented in this section are not fundamental deficiencies of DLO. Instead, they highlight the limitations of the numerical technique in implementing the DLO up to the present moment. With refined and improved numerical technique coupled with DLO, the authors expect that better results will be produced by DLO in the future. On the other hand, it is dangerous to compare the advantages and limitations of different stability methods based on old results or computer programs with limitations. Some of the comments in previous literature are possibly distorted by the limitations of the computational technique in computer programs instead of being the actual comparisons of different stability analysis methods.
2. b) Further Study on DLO, SRM and LEM
Cheng et al. (2007a) and many others have conducted comparisons between LEM and SRM, and it is generally found that the factor of safety and the critical failure surface are not sensitive to the dilation angle, and the results from SRM are comparable to LEM in most cases. Cheng et al. (2007a) have however found many minor problems in several commercial SRM programs in the previous study, and many of these commercial programs have updated the programs with reference to the case studies by Cheng et al. (2007a). With reference to the 45°slope as shown in Fig. 6 which has been studied by Cheng et al. (2006), the authors have also found that results from DLO are comparable to LEM and SRM in many cases, but there are some cases where greater differences (more than 5% in Table 1) are observed between DLO and other methods, which are worth consideration. In Table 1, the critical factors of safety by LEM are obtained by the Spencer method, and the results are close to that by the extremum principle except for the three values for the case of zero friction angle which are marked with * in Table1. In the full comparisons between the three methods, it is found that the factors of safety from DLO are always greater than those by the other methods, and the differences become greater with smaller friction angle, but the differences between the critical failure surfaces from the three methods are however minor. For SRM, the authors have found some surprising results from another program (new version) for which the results are given by cases 10 to 13 in Table 1. The SRM2 analysis is very sensitive to the dilation angle when the friction angle approaches 45°, and the factors of safety (as shown in bracket in Table 1) from this program are particularly low for SRM2 analysis. In view of the surprising SRM2 results for ?'=45° for that particular SRM program, the dilation angle is varied and the results are shown in Table 2. It is noticed that the computer program is very sensitive to the dilation angle case, and a small change in the dilation angle will give a significant change in the factor of safety which is obviously not correct. Furthermore, it is also noticed that a smaller dilation angle sometimes result in a higher factor of safety, which is again obviously wrong. For the critical failure surface, there are great differences between the case for c'=2kPa, ?'=40° and c'=2kPa, ?'=35° as shown in Fig. 7. In fact, the result in Fig7b is similar to that by LEM, DLO and SRM1, and the factor of safety from it is also close to the other three methods. It appears that SRM program determine a wrong critical failure surface and factor of safety, but the reason behind such problem is unknown and surprising. Cheng et al. (2007a) have found many limitations in the commercial SRM programs, and it appears that the updated version of some SRM programs may still face numerical problems under some cases which should be addressed. Being a new numerical method for DLO, the authors have considered another interesting case for this method. For a slope with very low to zero cohesive strength, the critical failure surface will be a shallow face failure. If the friction angle is equal to the slope angle, then the critical factor of safety of the slope should be equal to 1.0. From Table 3, it is however found that if c' is 0.03 kPa to 0, the critical factor of safety is much greater 1.0 while the critical failure surface is not a near surface failure. As long as c' is not too small, the results from DLO will then be normal. The authors view that the surprising results from DLO as shown in Tables 1 and 3 are the problems of the numerical implementation instead of the problem of DLO itself. It is possible that these kinds of problems may be overcome in the future, and the reason for the numerical problems behind DLO must be investigated. It is also interesting to note that the authors have never found such problem for LEM and SRM programs so far. For the problem with a soft band at soil layer 2 as discussed by Cheng et al. (2007a), surprising results are again obtained by DLO. The unit weight of the soils are 19 kN/m 3 , and c'=20 kPa and ?'=35° for soil layer 1, c'=0 kPa and ?'=25° for soil layer 2 and c'=10 kPa and ?'=35° for soil layer 3. As discussed by Cheng et al. (2007a), it appears that some SRM programs are affected by the size of the solution domain. The factor of safety for LEM is obtained as 0.927 by the Spencer method by Cheng et al. (2007a), and this value lie within Year 2022 ( ) J the SRM1 and SRM2 results by Plaxis and the new version of Phase (8.0). On the other hand, the factor of safety appears to be highly dependent on the nodal number adopted in the analysis. Even if 2000 nodal number is adopted, the factor of safety from DLO still appears to be unsatisfactory which is given in Table 4. The results by DLO are higher than those by LEM or SRM under all cases in Table 4, and the differences are not minor. Surprisingly, the critical failure surface from DLO as shown in Fig. 9 is similar to that by LEM or SRM (Cheng et al. 2007a). From Table 4, it can be concluded that the most influential factor in a proper DLO analysis is the nodal number.
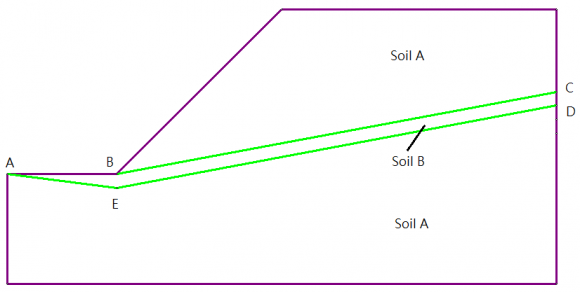
x y 0,0 0,5 If the third layer of soil instead of the second layer of soil is a soft material, the factor of safety has been established to be 1.29 from Spencer method, 1.27 from Extremum principle and 1.33 for SRM2 for all the SRM programs as discussed by Cheng et al. (2007a), and f(x) is relatively important for the present case (in general f(x) is not negligible if the friction angle is low). On the other hand, the result by DLO will approach the above factor of safety when the nodal number is large enough (Table 5). However, while the critical failure surfaces from LEM and SRM agree quite well as shown in Fig. 10a and 10b, the critical failure surface from DLO extends further to the right in Fig. 10c. To further examine these results, the authors have found another local minimum 1.29 with the Spencer method for the failure surface as shown in Fig. 11, which is very similar to that one by DLO as shown in Fig. 10. The authors view that a local minimum has been obtained from the DLO analysis. It should also be notes that the failure surfaces in Fig. 10a and Fig. 11 bear virtually the same factors of safety, and the differences between the two values are small so that it can be viewed that there are two global minimum for this problem. LEM can analyzed such problem easily while it takes more effort for SRM to detect the result in Fig. 11. Actually, without the previous knowledge about the existence of another global minimum, engineers will miss the result in Fig. 11 easily. For DLO, the failure surface as given by Fig. 10a or 10b cannot be obtained even increasing nodal number as given in Table 5. In this respect, there are some inherent limitation in the present development of DLO. It should be noted that c' is zero and ?' is smaller for the soft band layer. In the parametric study, different shear strength are used and DLO, LEM, SRM 1 and SRM 2 are carried out. SRM 1 is a non-associated flow rule analysis with a dilation angle = 0, while SRM 2 is an associated flow rule analysis with a dilation angle = friction angle. The thickness of soft band is set to be 500mm, 5mm and 2mm with three different slopes, while the soil properties are kept to be the same for three cases. In this analysis, number of nodes are set to be 500, 1000, 2000 in DLO and number of mesh are set to be 2000, 5000, 10000 in SRM. For the LEM, number of slices is set to be 50. Additionally, the number of mesh in SRM is increased (maximum 10000) to resolve the cases which the difference between SRM 1 and SRM 2 is significantly large (> 8%).
From the analysis, the FOS by SRM have great differences from those by DLO, particularly for the soft band problem with a thickness of 2mm. In model 1, the FOS are determined to be 1.163 and 1.396 from DLO (c' = 5 and 10 kPa for Soil A respectively) with 1000 nodes, while the FOS are 1.23 (c' = 5 kPa for Soil A) and 1.02 (c' = 10 kPa for Soil A) in SRM 1 with 5000 and 10000 meshes respectively. For SRM 2, the FOS are found to be 1.28 and 0.74 in the same cases, and FOS are 1.129 and 1.3362 from LEM.
For the slope analysis by DLO, one thing as found is that the number of nodes is a factor affecting the result. There can be no solutions for some cases in the three models. The number of nodes is required to adjust to fix the problem. For example in model 2 with soft band of 2mm thickness, the result cannot be determined if the number of nodes is set to be 1000. If it is 900, the solution can be determined. Another thing found in DLO is that the FOS changes slightly with the large change in the number of nodes (from 500 increases to 2000) in all cases.
In the SRM, the FOS obtained from SRM 2 should be larger than those from SRM 1 theoretically. Interestingly, the result from a SRM program shows that the FOS obtained from SRM 1 is larger than that from SRM 2 when the soft band becomes thinner or steeper. Apart from that, the difference between FOS from SRM 1 and SRM 2 is supposed to be small (around 2%), however, the differences are more than 2% for all the cases. In model 2 (c' = 10kPa for Soil A and the soft band has a thickness of 2mm), the FOS is found to be 1.05 from SRM 1 and 0.42 from SRM 2 with 10000 elements. The difference of FOS between them is 60.0%. If we look careful into the results in Tables in 6 to 8, we may be disappointed to find that commercial programs cannot perform well under some cases, and the errors can be significant or even ridiculous! For a new problem without any known solution, how should an engineer assess and accept the results from the computer programs is a difficulty issue. The reasons for these numerical problems should also be rectified in the updated versions of the commercial programs. In fact, the authors have tested several versions of the commercial programs and find that each version may give rise to different problems. So far, the authors cannot find a commercial SRM program which can be correct/reasonable under all cases! Actually, the authors
![Fig. 7: Critical failure surface for SRM2 analysis (c'=2 kPa), ?'=40° for (a) [cursor in (a)?] and 35° for (b)](https://engineeringresearch.org/index.php/GJRE/article/download/101554/version/101554/1-Critical-Review-of-Two-dimensional-Slope_html/33289/image-8.png)
| 24 | |||||||||||
| 22 | |||||||||||
| Leshchinsky-Ambauen (2015) | 20 | ||||||||||
| 18 | |||||||||||
| Spencer Method | 16 | ||||||||||
| 14 | |||||||||||
| 12 | |||||||||||
| 10 | A B | ||||||||||
| 8 | Bedrock | ||||||||||
| 6 | |||||||||||
| 4 | |||||||||||
| 2 | |||||||||||
| 0 | |||||||||||
| 0 | 5 | 10 | 15 | 20 | 25 | 30 | 35 | 40 | 45 | 50 | |
| Leshchinsky-Ambauen (2015) | |||||||||||
| Spencer Method | |||||||||||
| Leshchinsky-Ambauen (2015) | |||||||||||
| Spencer Method | |||||||||||
| Case | c'(kPa) | ?' | FOS(LEM) | FOS(DLO) | FOS(SRM1) | FOS(SRM2) |
| 1 | 5 | 5 | 0.41 | 0.44 | 0.42 | 0.42 |
| 2 | 10 | 5 | 0.65 | 0.71 | 0.67 | 0.67 |
| 3 | 10 | 15 | 0.98 | 1.04 | 0.98 | 1.01 |
| 4 | 20 | 5 | 1.06 | 1.22 | 1.13 | 1.14 |
| 5 | 20 | 15 | 1.48 | 1.61 | 1.51 | 1.53 |
| 6 | 20 | 25 | 1.85 | 1.96 | 1.87 | 1.88 |
| 7 | 5 | 0 | 0.2 (0.21*) | 0.24 | 0.21 | 0.21 |
| 8 | 10 | 0 | 0.4 (0.42*) | 0.47 | 0.44 | 0.44 |
| 9 | 20 | 0 | 0.8 (0.85*) | 0.95 | 0.89 | 0.89 |
| 10 | 2 | 45 | 1.35 | 1.40 | 1.42 | 1.44 (fail) |
| 11 | 5 | 45 | 1.65 | 1.70 | 1.68 | 1.74 (0.98) |
| 12 | 10 | 45 | 2.04 | 2.09 | 2.05 | 2.15 (1.1) |
| 13 | 20 | 45 | 2.69 | 2.79 | 2.67 | 2.83 (1.59) |
| Case | c' (kPa) | ?' ( °) | ?' ( °) | fos by SRM2 | fos by LEM |
| 1 | 2 | 45 | 45 | no solution | |
| 2 3 | 2 2 | 45 45 | 44.9 40 | no solution 1.22 | 1.35 |
| 4 | 2 | 45 | 35 | 1.4 | |
| 5 | 5 | 45 | 45 | 0.98 | |
| 6 7 | 5 5 | 45 45 | 44.9 40 | 1.19 1.47 | 1.65 |
| 8 | 5 | 45 | 35 | 1.69 | |
| 9 | 10 | 45 | 45 | 1.1 | |
| 10 11 | 10 10 | 45 45 | 44.9 40 | 1.49 2.05 | 2.04 |
| 12 | 10 | 45 | 35 | 2.06 | |
| 13 | 20 | 45 | 45 | 1.59 | |
| 14 15 | 20 20 | 45 45 | 44.9 40 | 2.03 2.62 | 2.69 |
| 16 | 20 | 45 | 35 | 2.67 |
| Case | c' (kPa) | ?' (°) | FOS |
| 1 | 0.03 | 30 | 1.42 |
| 2 | 0.1 | 30 | 1.01 |
| 3 | 0.03 | 35 | 1.62 |
| 4 | 0.1 | 35 | 1.02 |
| 5 | 0.03 | 40 | 1.84 |
| 6 | 0.1 | 40 | 1.02 |
| Year 2022 | ||||
| Fig. 8 | ||||
| 28m domain size, solution tolerance 0.01, different nodal density | ||||
| Case | Nodal No. | FOS by DLO | FOS by LEM | FOS difference with LEM (DLO %) |
| 1 | 250 | 1.356 | 0.927 | -46.28 |
| 2 | 500 | 1.069 | 0.927 | -15.32 |
| 3 | 1000 | 1.082 | 0.927 | -16.72 |
| 4 | 2000 | 1.055 | 0.927 | -13.81 |
| 28m domain size, nodal density 500, different solution tolerance | ||||
| Case | Solution tolerance | FOS by DLO | FOS by LEM | FOS difference with LEM (DLO %) |
| 1 | 0.01 | 1.069 | 0.927 | -15.32 |
| 2 | 0.001 | 1.069 | 0.927 | -15.32 |
| 3 | 0.004 | 1.069 | 0.927 | -15.32 |
| 4 | 0.005 | 1.069 | 0.927 | -15.32 |
| Solution tolerance 0.01, nodal density 500, different domain size | ||||
| Case | Domain Size (m) | FOS by DLO | FOS by LEM | FOS difference with LEM (DLO %) |
| 1 | 28 | 1.069 | 0.927 | -15.32 |
| 2 | 20 | 1.093 | 0.927 | -17.91 |
| 3 | 12 | 1.025 | 0.927 | -10.57 |
| Year 2022 | ||||||
| ( ) J | ||||||
| DLO analysis of soft soil layer 3 with | ||||||
| different nodal density (28 domain, solution tolerance 0.01) | ||||||
| Case Nodal No. | FOS by DLO | FOS by SRM2 | FOS by LEM | FOS difference with LEM (DLO%) | FOS difference with LEM (SRM2%) | |
| 1 | 250 | 1.405 | 1.33 | 1.27 | -8.91 | -3.10 |
| 2 | 500 | 1.358 | 1.33 | 1.27 | -5.27 | -3.10 |
| 3 | 1000 | 1.35 | 1.33 | 1.27 | -4.65 | -3.10 |
| Year 2022 | |||||||||
| Factor of safety FOS by DLO, LEM and SRM for case 1 | |||||||||
| Number of Nodes (DLO) | Number of Mesh (SRM) | Thickness of soft band (mm) | Soil Type c' (kPa) | ?' (°) | FOS (DLO) | FOS (LEM) | FOS (SRM 1) | FOS (SRM 2) | |
| 500 | Soil A Soil B | 5 0 | 35 25 | 1.096 | 1.1033 | 1.02 | 1.09 | ||
| 500 | Soil A Soil B | 10 0 | 35 25 | 1.275 | 1.1842 | 1.17 | 1.24 | ||
| 500 | 2000 | 5 5 | Soil A Soil B Soil A Soil B | 5 0 10 0 | 35 25 25 35 | 1.165 1.396 | 1.1279 1.3347 | 1.2 0.98 | 1.28 0.9 |
| ( ) J | 2 2 | Soil A Soil B Soil A Soil B | 5 0 10 0 | 35 25 35 25 | 1.166 1.397 | 1.129 1.3362 | 1.24 0.96 | 1.28 0.7 | |
| 5 | Soil A Soil B | 5 0 | 35 25 | 1.162 | 1.1279 | 1.22 | 1.28 | ||
| 1000 | 5000 | 5 2 | Soil A Soil B Soil A Soil B | 10 0 5 0 | 35 25 35 25 | 1.395 1.163 | 1.3347 1.129 | 1.22 1.23 | 0.95 1.28 |
| 2 | Soil A Soil B | 10 0 | 35 25 | 1.396 | 1.3362 | 0.93 | 0.85 | ||
| 2000 | 10000 | 5 2 | Soil A Soil B Soil A Soil B | 10 0 10 0 | 35 25 35 25 | No Solution 1.395 (1000 nodes) 1.396 (1000 nodes) No Solution | 1.3347 1.3362 | 1.21 1.02 | 0.96 0.74 |
| © 2022 Global Journals | |||||||||
| of conditions. | |||||||||
| Number of Nodes (LEM) | Number of Mesh (SRM) | Thickness of soft band (mm) | Soil Type c' (kPa) | ?' (°) | FOS (DLO) | FOS (LEM) | FOS (SRM 1) | FOS (SRM 2) | |
| 500 | Soil A Soil B | 5 0 | 35 25 | 1.06 | 1.0522 | 0.98 | 1.04 | ||
| 500 | Soil A Soil B | 10 0 | 35 25 | 1.223 | 1.1937 | 1.11 | 1.17 | ||
| 500 | 2000 | 5 5 | Soil A Soil B Soil A Soil B | 5 0 10 0 | 35 25 25 35 | 1.128 1.338 | 1.0924 1.2829 | 1.2 1.16 | 1.27 0.94 |
| 2 | Soil A Soil B | 5 0 | 35 25 | No Solution 1.127 (600 nodes) | 1.0935 | 1.21 | 1.27 | ||
| 2 | Soil A Soil B | 10 0 | 35 25 | 1.34 | 1.2833 | 1.05 | 0.4 | ||
| 5 | Soil A Soil B | 5 0 | 35 25 | 1.123 | 1.0924 | 1.22 | 1.28 | ||
| 1000 | 5000 | 2 5 | Soil A Soil B Soil A Soil B | 10 0 5 0 | 35 35 25 25 | 1.126 (900 nodes) No Solution 1.337 | 1.0935 1.2829 | 1.2 1.37 | 1.27 0.79 |
| 2 | Soil A Soil B | 10 0 | 35 25 | No Solution 1.339 (900 nodes) | 1.2833 | 1.48 | 0.35 | ||
| 2000 | 10000 | 5 2 | Soil A Soil B Soil A Soil B | 10 0 10 0 | 35 25 35 25 | No Solution 1.337 (1000 nodes) 1.339 (900 nodes) No Solution | 1.2829 1.2833 | 1.37 1.05 | 0.74 0.42 |
| Factor of safety FOS by DLO, LEM and SRM for case 3 | |||||||||
| Number of Nodes (LEM) | Number of Mesh (SRM) | Thickness of soft band (mm) | Soil Type c' (kPa) | ?' (°) | FOS (DLO) | FOS (LEM) | FOS (SRM 1) | FOS (SRM 2) | |
| 500 | Soil A Soil B | 5 0 | 35 25 | 1.021 | 1.0288 | 0.93 | 1 | ||
| 500 | Soil A Soil B | 10 0 | 35 25 | 1.169 | 1.138 | 1.06 | 1.13 | ||
| 500 | 2000 | 5 5 | Soil A Soil B Soil A Soil B | 5 0 10 0 | 35 25 35 25 | No Solution 1.083 (600 nodes) No Solution 1.276 (600 nodes) | 1.0528 1.217 | 1.1 1.06 | 0.99 0.74 |
| 2 | Soil A Soil B | 5 0 | 35 25 | 1.084 | 1.0548 | 1.16 | 1.27 | ||
| 2 | Soil A Soil B | 10 0 | 35 25 | No Solution 1.278 (600 nodes) | 1.2106 | 1.42 | 0.29 | ||
| 5 | Soil A Soil B | 5 0 | 35 25 | No Solution 1.082 (700 nodes) | 1.0528 | 1.1 | 0.98 | ||
| 1000 | 5000 | 5 2 | Soil A Soil B Soil A Soil B | 10 0 5 0 | 35 25 25 35 | No Solution 1.276 (950 nodes) 1.082 | 1.217 1.0548 | 1.1 0.995 | 0.93 1.26 |
| 2 | Soil A Soil B | 10 0 | 35 25 | 1.277 | 1.2106 | 1.44 | 0.8 | ||
| 5 | Soil A Soil B | 5 0 | 35 25 | No Solution 1.082 (700 nodes) | 1.0528 | 1.08 | 0.77 | ||
| 2000 | 10000 | 5 2 | Soil A Soil B Soil A Soil B | 10 0 5 0 | 35 25 35 25 | No Solution 1.276 (950 nodes) 1.081 (1900 nodes) No Solution | 1.217 1.0548 | 0.995 1.17 | 0.74 1.26 |
| 2 | Soil A Soil B | 10 0 | 35 25 | No Solution 1.276 (1800 nodes) | 1.2106 | 1.5 | 1.1 | ||