1. Introduction
ust like all natural events, earthquakes are random in occurrence. This randomness makes the use of statistics and probabilistic theory extremely suitable for analyzing earthquakes inter-event recurrence intervals (IRIs). Many studies have been conducted in India and around the world to substantiate the suitability of various distribution models for fairly assessing the conditional probabilities of earthquake recurrences. All such studies investigated the distribution of recurrence interval using established probabilistic models and analyzing their best fit employing various goodness-of-fit tests.
In India, extensive work has been done by researchers towards assessing earthquake inter-event recurrence intervals in various regions including western and northwestern parts Kachch (Tripathi and Nath (2001), Rajendran and Rajendran (2003)), north-eastern regions (Yadav et al. (2010)) and Himalayan region (Bungum et al. (2017)). These studies are conducted considering various probabilistic models like Lognormal, Gamma, Weibull, Exponential, Brownian Passage Time (BPT), and Poisson model with parameter estimation using maximum likelihood method and validating data fitting through Kolmogorov-Smirnov statistical method and Anderson-Darling method.
Similarly, a considerable amount of work has been done globally, like the one done by Yilmaz et al. Bayrak et al. (2015) for north Anatolian fault zone in Turkey using Weibull, lognormal, exponential and gamma models with Kolmogorov-Smirnov test; Kinasih et al. Kinasih et al. (2014) for the Lesser Sunda Islands using Weibull distribution over different categories of earthquake magnitudes (low, medium and high) and the most recent one by the Coban et. Coban and Sayil (2019) et al., towards evaluating the earthquake recurrence in western Antatolia using five different probabilistic models with an estimation of model parameters using the maximum likelihood method.
Most of these studies concluded Weibull as the best approximation model for earthquake IRI estimation. Hardly any research has been conducted for central India to analyze the probabilities of recurrence of earthquakes, especially for earthquakes with a magnitude greater than 4 in the region. Present study attempts to analyze the pattern of recurrence of earthquakes in the region by analyzing IRIs using the Weibull distribution model.
2. II.
3. Methodology a) Study Region for this research
Although higher magnitude earthquakes are infrequent in central India, the catalog for central India suggests a notable frequency of earthquakes with magnitude ranging from 3 to 5. One of the most significant and damaging earthquakes (Mw 5.8) ever experienced in this region is the one that struck on 21st May 1997 in the city of Jabalpur, which lies on the Central Indian Tectonic Zone (CITZ). The central part of the Indian subcontinent mainly consists of four tectonic regimes i.e., the Bundelkhand Craton, the Satpura Mobile Belt, Kotri-Dongergarh Mobile Belt, and the Bastar Craton. Besides, the Narmada-Son Lineament and Central Indian Suture (CIS) are also critical tectonic elements of this regime. The faults and lineaments considered under this study are taken from the Seismotectonic Atlas of India and its Environs published by Geological Survey of India. The records have been digitized and using GIS application QGIS in different layers along with historical seismic records over the map of the study region. Based on the cluster of sources and historical seismicity, the study region is divided into four zones as potential seismic sources to study the earthquake recurrence pattern as shown in Figure 1. In this study, a new earthquake catalog for the study region has been compiled using various national and international resources with an aim to perform consistent seismic hazard assessment. A total of 187 seismic events are considered in earthquake data from 1995. The catalog is uniformly harmonized in terms of Mw. In the absence of any dedicated conversion formula for the study region, the global conversion formulae proposed by E. M. Scordilis (2006) have been used for magnitude conversion. After zone-wise distribution of seismic events, for each zone, the catalog has been de-clusterized in order to remove the foreshocks and aftershock events. In order to the catalog, an algorithm proposed by Reasenberg (1985) has been used using ZMAP software. The algorithm assumes the inter-connectivity of seismic events both in terms of space and time. The algorithm correctly filtered all foreshocks and aftershocks from events. The region is divided into four zones (South, West, North, and East), and these four zones are further analyzed by clustering earthquakes into two categories of magnitudes, as shown in Tables 1, 2, 3, and 4. A wide range of magnitudes are considered in the second category to compensate for the fewer events of higher magnitude, especially those with magnitude ? 5.
4. c) Model Selection
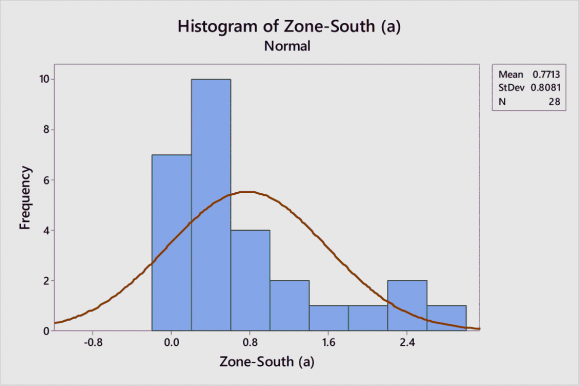
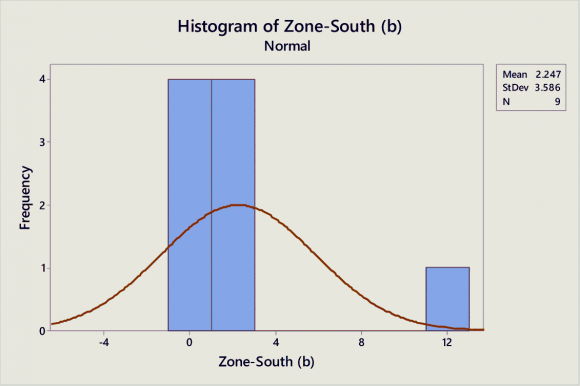
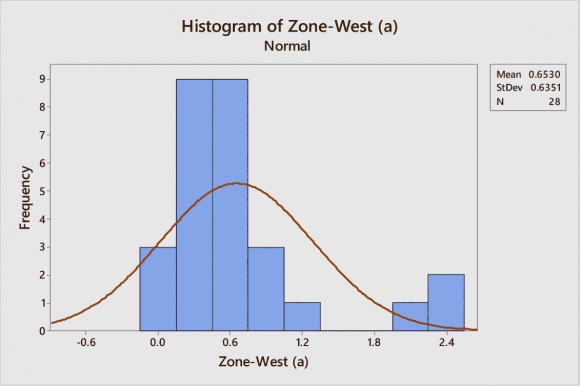
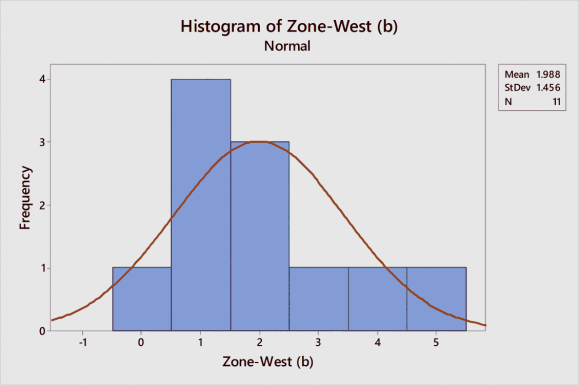
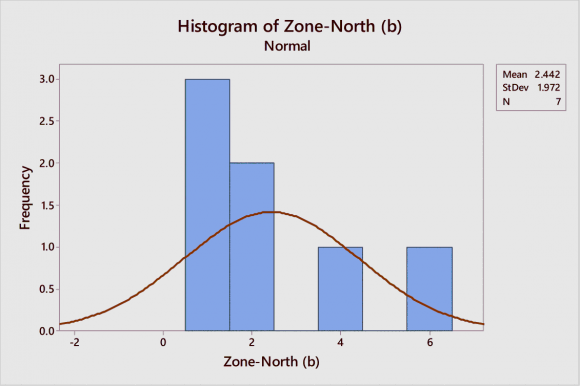
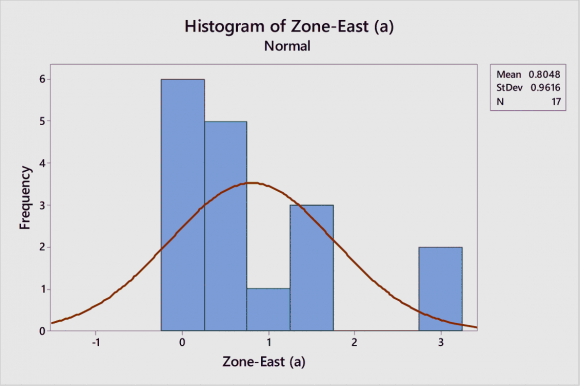
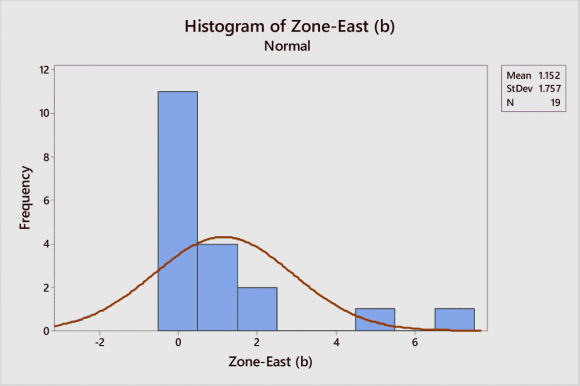
Histograms plots are obtained for IRIs for different zones. All the plots thus obtained showed a tendency to left-skew, as shown in figures 2, 3, 4, and 5. This skewness reflects their belonging to a skeweddistribution family such as exponential, lognormal, or Weibull. Where ? (t) is the cumulative probability of the next earthquake that will occur at a time later than t, and t is the time measured in years from the time of the last earthquake.
If (?/t ) is the conditional probability that the next earthquake will occur
5. Probabilistic Analysis Method
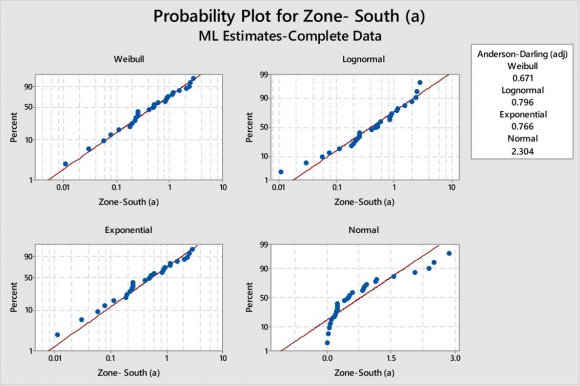
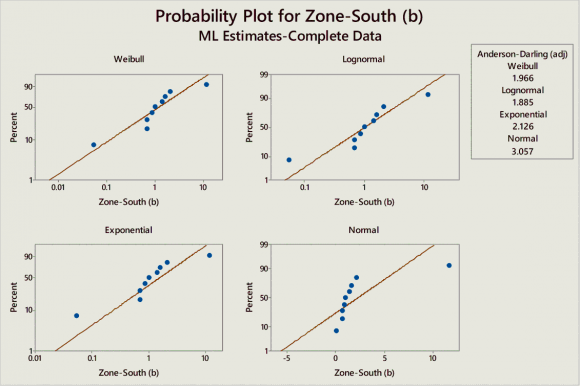
Variability in data and extremities in values are the significant reasons for selecting Weibull as a suitable model for analyzing earthquake recurrence intervals. The two-parameter Weibull distribution is the predominant distribution in reliability and lifetime data analysis used to model extreme value data. The twoparameter Weibull distribution has shown effective results for assessing earthquake recurrence intervals and is commonly used in modeling such data(Ram Bichar Singh Yadav 2015)). The classical approach for estimating the scale and shape parameters employs the maximum likelihood estimation (MLE) method. The hazard function of Weibull is time-dependent with hazard increasing with time when the shape factor is greater than one and decreasing when it is less than one. When the shape factor equals one, the Weibull hazard function becomes constant or equivalent to the exponential function. The estimated parameters are tested to fit the distribution using the Anderson-Darling test.
6. b) Zone-wise probability calculation
i. Zone South Zone South has 48 earthquakes recorded from the year 1995 to 20017 with maximum magnitude 2.9 and minimum magnitude 5.3, minimum depth as 0, and maximum as 45.7. Declustering is done by using the declustering function of ZMAP software which evaluated total five clusters in the zone with a total of 10 events as aftershocks, foreshocks, or dependent events out of total 48 events. The zone is further grouped into two categories based on earthquake magnitudes.
For South (a) category, the maximum recorded earthquake is of magnitude 3.9 (1996), whereas the minimum recorded earthquake is of magnitude 3 (2017). The last earthquake for this zoning category is recorded in 2017.
Similarly, for South (b) category, the maximum recorded earthquake is of magnitude 5.3 (2001), whereas the minimum recorded earthquake is of magnitude 4 (2015). The last earthquake for this zoning category is recorded in 2015. The estimated model parameters (scale, shape) are listed in Table 5.The conditional probabilities as per the Weibull model are as given in Table 6.
7. ii. Zone West
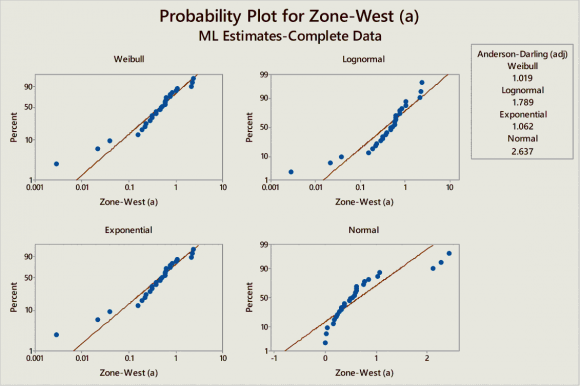
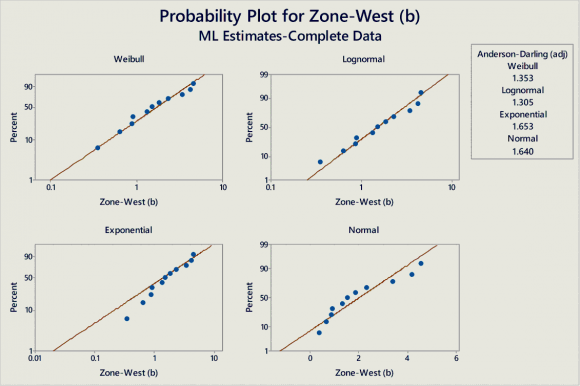
Zone West has 55 earthquakes recorded from the year 1996 to 20017 with maximum magnitude 4.9 and minimum magnitude 2.8, minimum depth as 0 (not recorded) and maximum as 40.6. Declustering is done by using the declustering function of ZMAP software which evaluated total three clusters in the zone is a total of 7 events as aftershocks, foreshocks, or dependent events out of total 55 events.
For Zone West (a) category, the maximum recorded earthquake is of magnitude 3.9 (2002), whereas the minimum recorded earthquake is of magnitude 3.1 (2016). The last earthquake for this zoning category is recorded in 2016.
Similarly, for Zone West (b) category, the maximum recorded earthquake is of magnitude 4.9 (2010), whereas the minimum recorded earthquake is of magnitude 4.1 (2013). The last earthquake for this zoning category is recorded in 2017. The estimated model parameters (scale, shape) are listed in Table 5. iii. Zone North Zone North has 25 earthquakes recorded from the year 1999 to 2017 with maximum magnitude 2.2 and minimum magnitude 4.6, minimum depth as 1.2, and maximum as 35. Declustering is done by using the declustering function of ZMAP software which evaluated total four clusters in the zone with a total of 8 events as aftershocks, foreshocks or dependent events out of total 25 events.
For Zone North (a) category, the maximum recorded earthquake is of magnitude 3.8 (2016), whereas the minimum recorded earthquake is of magnitude 3.0 (1999). The last earthquake for this zoning category is recorded in 2016. Similarly, for Zone North (b) category, the maximum recorded earthquake is of magnitude 4.5 (2013), whereas minimum recorded earthquake is of magnitude 4.0 (2013). The last earthquake for this zoning category is recorded in 2016. The estimated model parameters (scale, shape) are listed in Table 5.
8. iv. Zone East
Zone East has 59 earthquakes recorded from the year 1995 to 20017 with maximum magnitude 2.8 and minimum magnitude 6.1, minimum depth as 0 and maximum as 82.9. Declustering is done by using declustering function of ZMAP software which evaluated total ten clusters in the zone with a total of 24 events as aftershocks, foreshocks, or dependent events out of total 59 events.
For Zone East (a) category, the maximum recorded earthquake is of magnitude 3.9 (2002), whereas minimum recorded earthquake is of magnitude 3.1 (2003). The last earthquake for this zoning category is recorded in 2016.
Similarly, for Zone East (b) category, the maximum recorded earthquake is of magnitude 6.1 (1997), whereas minimum recorded earthquake is of magnitude 4.0 (2016). The last earthquake for this zoning category is recorded in 2017. The estimated model parameters (scale, shape) are listed in Table 5.
IV.
9. Results & Discussion
The stochastic methodology is applied to the earthquake inter-event recurrence intervals for earthquakes recorded in the past 100 years by classifying the whole region into four zones based on the clusters of seismogenic faults and historical seismicity. Similar studies have been done for other regions in India and around the world with many promising results in terms of conditional probabilities for assessing future hazard scenarios. The generalized exponential behavior, memory-less-ness, best fitting in terms of data, and promising results in other similar studies became reasons for the use of Weibull probability distribution as a modeling function for the earthquake IRIs in this study. Zone-wise conditional probability for different groups of earthquake magnitudes are calculated using respective model parameters. The results cover all possible combinations of elapsed time (t) and remaining time (?) with an incremental value of 3 years. The following results are observed in this study:
1. The mean Weibull IRI (? mean ) for the next event in for category (a) of magnitudes (3<= Mw < 4) came out to be 1.68 years whereas for category (b) of magnitudes (4<= Mw <= 6) it came out to be 0.98 years.
10. The average remaining time for category (b)
earthquakes is found to be less than that of category (a) earthquakes. 3. The estimated elapsed time (t) since the last earthquake as per catalog is added to the Weibull occurrence year as estimated from the equation for the maximum suggested by Sergio G. Ferraes (2003), and the results are presented in Table 11. 4. Results show that the probability of occurrence of 4 to 5 magnitude earthquakes is higher for zone South in 2022, zone West, and North in 2021 and zone East in 2022. 5. Similarly, the probability of occurrence of 3 to 5 magnitude earthquakes is higher for all the zones in 2022. 6. The average IRI with maximum probability is found to be 3.25 years for earthquakes ranging from magnitude 3 to 6. 7. For category (a) magnitudes in all the zones, the average IRI with maximum probability is found to 4.17 years 8. For category (b) magnitudes in all the zones, it is found to be 1.59 years. 9. The standard deviation category (a) earthquakes IRI is found to be maximum as 5.08, whereas it is found to be least for category (b) earthquakes IRI as 0.83. 10. It is observed the probability of recurrence for category (a) earthquakes is higher as compared to that of category (b) earthquakes with exception in Zone North, where the probability of recurrence of category (b) earthquakesis found to be higher than category (a) earthquakes.
11. Volume Xx XI Issue I V ersion I Global Journal of Researches in Engineering
( )
E 11.The log-likelihood is found to be least for zone North (a) & (b) categories, justifying the data pertaining to this zone to be the best-fit for the Weibull distribution model.
V.
12. Conclusions
The following conclusions are drawn from this study:
1. For all zones, category (a) magnitude have a longer time duration between next earthquakes while category (b) magnitudes have a shorter duration for the earthquake to happen. 2. Years 2021 to 2023 are critical for the entire region as significant seismological activity is predicted. This time must be suitably utilized at least for projects under construction to assure sufficient detailing measures are undertaken.
15 1 1 1 1 1 1 1 1 1 1 1 18 1 1 1 1 1 1 1 1 1 1 1 21 1 1 1 1 1 1 1 1 1 1 1 24 1 1 1 1 1 1 1 1 1 1 1 27 1 1 1 1 1 1 1 1 1 1 1 30 1 1 1 1 1 1 1 112 1 1 1 1 1 1 1 1 1 1 1 15 1 1 1 1 1 1 1 1 1 1 1 18 1 1 1 1 1 1 1 1 1 1 1 21 1 1 1 1 1 1 1 1 1 1 1 24 1 1 1 1 1 1 1 1 1 1 1 27 1 1 1 1 1 1 1 1 1 1 112 1 1 1 1 1 1 1 1 1 1 1 15 1 1 1 1 1 1 1 1 1 1 1 18 1 1 1 1 1 1 1 1 1 1 1 21 1 1 1 1 1 1 1 1 1 1 1 24 1 1 1 1 1 1 1 1 1 1 1 27 1 1 1 1 1 1 1 1 1 1 1 30 1 1 1 1 1 1 1 1 1 11Conditional Probabilities using Weibull Method for ZONE West (b) category Modelling Earthquake's Inter-event Recurrence Intervals (IRIs) in Central India and Adjoining Regions using Weibull Probability Distribution Model -A Zone-Wise Approach
1 1 1 1 1 1 1 1 1 1 1 6 1 1 1 1 1 1 1 1 1 1 1 9 1 1 1 1 1 1 1 1 1 1 1 12 1 1 1 1 1 1 1 1 1 1 1 15 1 1 1 1 1 1 1 1 1 1 1 18 1 1 1 1 1 1 1 1 1 1 1 21 1 1 1 1 1 1 1 1 1 1 1 24 1 1 1 1 1 1 1 1 1 1 1 27 1 1 1 1 1 1 1 1 1 1 1 30 1 1 1 1 1 1 1 1 1 1 1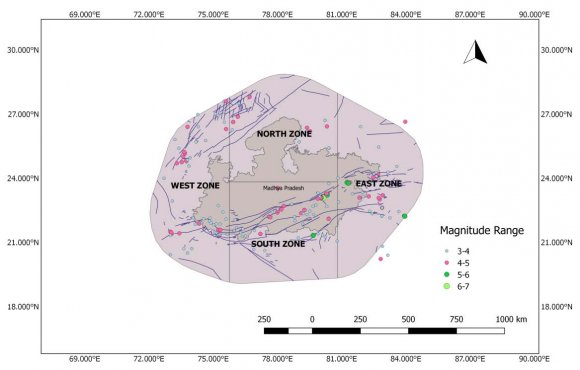
![during the time interval between t and ?, then it is given as Weibull Conditional Probability: ??(??/??) = (1 ? ?? ?[?? * [(??+??) ?? ??? ?? ] ?? for Maximum Conditional Probability as proposed by Sergio G Ferraes (2003): ?? = 1 ?????? ?? ?1 III.](https://engineeringresearch.org/index.php/GJRE/article/download/101505/version/101505/4-Modelling-Earthquakes-Inter-event_html/32429/image-7.png)
| S. No. | Longitude | Latitude | Year | Month | Day | Magnitude | Depth | Hour | Minute |
| South (a) category Earthquake Catalog | |||||||||
| 1 | 77.60 | 22.20 | 1996 | 1 | 10 | 3.90 | 33 | 10 | 37 |
| 2 | 78.00 | 22.57 | 1998 | 7 | 19 | 3.80 | 33 | 0 | 57 |
| 3 | 76.09 | 21.69 | 1998 | 10 | 20 | 3.10 | 2 | 0 | 5 |
| 4 | 76.23 | 21.62 | 1998 | 10 | 24 | 3.00 | 1 | 0 | 48 |
| 5 | 76.38 | 21.63 | 1998 | 11 | 5 | 3.50 | 10.8 | 0 | 42 |
| 6 | 77.19 | 22.12 | 1999 | 5 | 11 | 3.00 | 5 | 0 | 56 |
| catalog for West (a) & (b) category in Madhya Pradesh and adjoining regions | |||||||||
| S. No. | Longitude | Latitude | Year | Month | Day | Magnitude | Depth | Hour | Minute |
| West (a) category Earthquake Catalog | |||||||||
| 1 | 75.46 | 22.42 | 1998 | 9 | 13 | 3.30 | 15 | 0 | 42 |
| 2 | 73.76 | 24.76 | 1998 | 12 | 26 | 3.40 | 5 | 0 | 14 |
| S. No. | Longitude | Latitude | Year | Month | Day | Magnitude | Depth | Hour | Minute |
| North (a) category Earthquake Catalog | |||||||||
| 1 | 76.45 | 26.40 | 1999 | 7 | 3 | 3.00 | 10 | 0 | 59 |
| 2 | 79.02 | 25.69 | 2000 | 10 | 7 | 3.40 | 33 | 0 | 32 |
| 3 | 76.20 | 27.50 | 2012 | 12 | 20 | 3.60 | 5 | 13 | 0 |
| 4 | 75.00 | 27.20 | 2013 | 3 | 31 | 2.30 | 5 | 14 | 43 |
| 5 | 75.52 | 26.62 | 2013 | 9 | 5 | 3.20 | 11.1 | 0 | 29 |
| 6 | 79.40 | 26.20 | 2013 | 9 | 23 | 3.50 | 5 | 13 | 26 |
| 7 | 75.50 | 27.60 | 2014 | 4 | 27 | 3.40 | 5 | 9 | 14 |
| 8 | 75.50 | 27.10 | 2016 | 1 | 28 | 3.80 | 10 | 22 | 47 |
| 9 | 75.25 | 26.94 | 2016 | 4 | 7 | 3.40 | 10 | 0 | 3 |
| North (b) category Earthquake Catalog | |||||||||
| 1 | 80.31 | 26.42 | 1999 | 10 | 13 | 4.10 | 15 | 6 | 56 |
| 2 | 80.22 | 26.71 | 2001 | 1 | 8 | 4.00 | 33 | 0 | 44 |
| 3 | 79.38 | 26.36 | 2005 | 1 | 14 | 4.20 | 33 | 5 | 16 |
| 4 | 75.93 | 26.63 | 2006 | 12 | 23 | 4.30 | 1.2 | 22 | 43 |
| 5 | 75.89 | 26.26 | 2013 | 2 | 24 | 4.00 | 35 | 0 | 57 |
| 6 | 79.52 | 26.20 | 2013 | 9 | 23 | 4.50 | 10 | 0 | 26 |
| 7 | 75.60 | 27.60 | 2015 | 9 | 3 | 4.40 | 10 | 17 | 57 |
| 8 | 76.70 | 27.80 | 2016 | 11 | 16 | 4.40 | 10 | 22 | 58 |
| S. No. | Longitude Latitude | Year | Month | Day | Magnitude Depth | Hour | Minute | ||
| East (a) category Earthquake Catalog | |||||||||
| 1 | 75.46 | 22.42 | 1998 | 9 | 13 | 3.30 | 15 | 0 | 42 |
| 2 | 73.76 | 24.76 | 1998 | 12 | 26 | 3.40 | 5 | 0 | 14 |
| 3 | 75.15 | 21.45 | 1999 | 3 | 3 | 3.30 | 20 | 0 | 43 |
| 4 | 74.16 | 21.84 | 1999 | 7 | 17 | 3.40 | 5 | 0 | 48 |
| 5 | 74.45 | 21.92 | 2000 | 4 | 14 | 3.40 | 10 | 0 | 41 |
| 6 | 75.03 | 21.83 | 2000 | 7 | 10 | 3.50 | 20 | 0 | 6 |
| 7 | 74.85 | 22.13 | 2000 | 7 | 24 | 3.30 | 15 | 0 | 19 |
| 8 | 75.24 | 22.72 | 2001 | 1 | 12 | 3.40 | 2.9 | 0 | 36 |
| 9 | 73.09 | 22.94 | 2002 | 1 | 23 | 3.20 | 19.8 | 0 | 11 |
| 10 | 75.07 | 21.47 | 2002 | 5 | 19 | 3.90 | 30.9 | 0 | 25 |
| 11 | 73.87 | 24.57 | 2002 | 9 | 13 | 3.40 | 10 | 0 | 35 |
| 12 | 73.62 | 20.71 | 2002 | 12 | 1 | 3.10 | 1.6 | 0 | 33 |
| 13 | 74.55 | 22.10 | 2003 | 12 | 23 | 3.70 | 5 | 0 | 9 |
| 14 | 74.07 | 22.15 | 2003 | 12 | 24 | 3.10 | 40.6 | 0 | 47 |
| a) Parameters Estimation for earthquake IRIs | |||||||||
| Volume Xx XI Issue I V ersion I | |||||||||
| ( ) E | |||||||||
| Shape Factor Scale Factor | Zone South (a) 0.924 0.743 | Zone South (b) 0.809 1.955 | Weibull distribution model Zone West (a) Zone West (b) Zone North (a) 1.03 1.482 0.642 0.66 2.209 1.381 | Zone North (b) 1.436 2.711 | Zone East (a) 0.863 0.742 | Zone East (b) 0.647 0.832 | Global Journal of Researches in Engineering | ||
| Log-Likelihood | -20.583 | -15.529 | -16.047 | -17.397 | -11.952 | -12.58 | -12.975 | -17.97 | |
| Mean | 0.771 | 2.25 | 0.653 | 1.988 | 2.1 | 2.442 | 0.805 | 1.152 | |
| Conditional Probabilities using Weibull Method for ZONE South (a) category | |||||||||||
| Elapsed Time | |||||||||||
| Remaining Time (t) | 0 | 3 | 6 | 9 | 12 | 15 | 18 | 21 | 24 | 27 | 30 |
| 3 | 0.871 | 0.841 0.829 0.821 0.816 0.811 0.807 0.803 | 0.8 | 0.797 0.795 | |||||||
| 6 | 0.98 | 0.973 | 0.97 | 0.967 0.965 0.963 0.962 0.961 | 0.96 | 0.958 0.958 | |||||
| 9 | 0.997 | 0.995 0.994 0.994 0.993 0.993 0.992 0.992 0.992 0.991 0.991 | |||||||||
| 12 | 0.999 | 0.999 0.999 0.999 0.999 0.999 0.998 0.998 0.998 0.998 0.998 | |||||||||
| Conditional Probabilities using Weibull Method for ZONE West (a) category | |||||||||||
| Remaining Time | Elapsed Time | ||||||||||
| 3 | 0.871 | 0.881 | 0.885 | 0.888 | 0.89 | 0.891 | 0.892 | 0.893 | 0.894 | 0.895 | 0.896 |
| 6 | 0.985 | 0.986 | 0.987 | 0.988 | 0.988 | 0.988 | 0.989 | 0.989 | 0.989 | 0.989 | 0.989 |
| 9 | 0.998 | 0.998 | 0.999 | 0.999 | 0.999 | 0.999 | 0.999 | 0.999 | 0.999 | 0.999 | 0.999 |
| Conditional Probabilities using Weibull Method for ZONE North (a) category | |||||||||||
| Remaining | |||||||||||
| Time | 0 | 3 | 6 | 9 | 12 | 15 | 18 | 21 | 24 | 27 | 30 |
| (Years) | |||||||||||
| 3 | 0.939 | 0.791 | 0.727 | 0.683 | 0.65 | 0.623 | 0.601 | 0.582 | 0.566 | 0.552 | 0.539 |
| 6 | 0.987 | 0.943 | 0.913 | 0.889 | 0.868 | 0.85 | 0.833 | 0.819 | 0.805 | 0.793 | 0.782 |
| 9 | 0.997 | 0.982 | 0.97 | 0.958 | 0.947 | 0.937 | 0.928 | 0.919 | 0.91 | 0.902 | 0.895 |
| 12 | 0.999 | 0.994 | 0.989 | 0.983 | 0.978 | 0.973 | 0.968 | 0.962 | 0.958 | 0.953 | 0.948 |
| 15 | 1 | 0.998 | 0.995 | 0.993 | 0.99 | 0.988 | 0.985 | 0.982 | 0.979 | 0.977 | 0.974 |
| 18 | 1 | 0.999 | 0.998 | 0.997 | 0.996 | 0.994 | 0.993 | 0.991 | 0.99 | 0.988 | 0.987 |
| 21 | 1 | 1 | 0.999 | 0.999 | 0.998 | 0.997 | 0.997 | 0.996 | 0.995 | 0.994 | 0.993 |
| 24 | 1 | 1 | 1 | 0.999 | 0.999 | 0.999 | 0.998 | 0.998 | 0.997 | 0.997 | 0.996 |
| 27 | 1 | 1 | 1 | 1 | 1 | 0.999 | 0.999 | 0.999 | 0.999 | 0.998 | 0.998 |
| 30 | 1 | 1 | 1 | 1 | 1 | 1 | 1 | 0.999 | 0.999 | 0.999 | 0.999 |
| Conditional Probabilities using Weibull Method for ZONE North (b) category | |||||||||||
| 3 | 0.986 | 0.986 | 0.986 | 0.986 | 0.986 | 0.986 | 0.986 | 0.986 | 0.986 | 0.986 | 0.986 |
| 1 | 1 | 1 | 1 | 1 | |||||||
| Conditional Probabilities using Weibull Method for ZONE East (a) category | |||||||||||
| Remaining | |||||||||||
| Time | 0 | 3 | 6 | 9 | 12 | 15 | 18 | 21 | 24 | 27 | 30 |
| (Year) | |||||||||||
| 3 | 0.853 | 0.792 | 0.768 | 0.752 | 0.74 | 0.73 | 0.722 | 0.715 | 0.709 | 0.703 | 0.698 |
| 6 | 0.969 | 0.952 | 0.942 | 0.935 | 0.93 | 0.925 | 0.921 | 0.917 | 0.913 | 0.91 | 0.907 |
| Last | Probable | ||||||
| ZONE | ? (Scale) | ? (Shape) | T | ? | T+ ? | Event | Year for Next |
| Year | Event | ||||||
| South (a) | 0.743 | 0.924 | 3 | 1.58 | 5 | 2017 | 2022 |
| South (b) | 1.955 | 0.809 | 5 | 0.86 | 6 | 2015 | 2021 |
| West (a) | 0.66 | 1.03 | 4 | 1.41 | 6 | 2016 | 2022 |
| West (b) | 2.209 | 1.482 | 3 | 0.18 | 4 | 2017 | 2021 |
| North (a) | 1.381 | 0.642 | 4 | 1.85 | 6 | 2016 | 2022 |
| North (b) | 2.711 | 1.436 | 4 | 0.14 | 5 | 2016 | 2021 |
| East (a) | 0.742 | 0.863 | 4 | 1.89 | 6 | 2016 | 2022 |
| East (b) | 0.832 | 0.647 | 3 | 2.74 | 6 | 2017 | 2023 |
| Mean | Standard Deviation | Minimum | Maximum | Range | |
| All Zones | 1.33 | 0.89 | 0.14 | 2.74 | 2.6 |
| Category (a) | 1.68 | 0.22 | 1.41 | 1.89 | 0.48 |
| Category (b) | 0.98 | 1.21 | 0.14 | 2.74 | 2.6 |