1. I. INTRODUCTION he electrocardiogram (ECG or EKG from the
German Elektrokardiogram) refers to the linear recording of quasi-periodical, rhythmically repeating small voltage signal (~1mV) synchronized by the heart, the bioelectric event generator [1,2]. The term ECG was coined into medical practice 100 years ago by Nobel Prize winner, William Einthoven, who first introduced the fundamental function of the ECG [1]. Like a signature or figure-print, ECG provides electrophysiology that indicates an overview of the cardiac health. The non-invasive recording process and the visual interpretation facility have made it as a powerful tool for the medical professionals to extract clinical information about of their patients' health. The starting point for electrocardiography is the detection of Rspikes of QRS-complex and then P and T waves reflecting the process of depolarization of the ventricles, atria & final re-polarization of ventricular myocardium respectively [3]. Researchers of biomedical field have set the standard amplitude and duration values of those peaks and their derivatives. Deviation from the standard value and asymmetric phase relationships of the resulting ECG signal reflect abnormality of the human body. Thus, it is used as the primary diagnostic tool of almost all heart diseases. Sometimes, a short period ECG test in the clinical environment may prove not to be steady at all, as often it cause imperfect reports which is a threat to the potentially lethal patients. Arrhythmia, a disease caused by irregularity in heart rhythm has always been unpredictable for short time ECG Test [4]. Those limitations often let physicians to prescribe costly hazardous diagnosis instead this non-invasive method. In spite of these highlighted drawbacks of ECG accuracy, it does not lose its zeal in patient's mind because of its cost-effectiveness and availability. Regarding this issues, a lot of researches have been carried out recently to make ECG analysis as accurate as possible. To reduce the noise and artifacts as possible, highly efficient ECG machine with the combination of analog and digital filter is of ultimate necessity in modern cardio pathology. Again, automatic detection software is now also included in all ECG system with digital display and dedicated printing facility. But the philosophy of ECG detection method behind the gorgeous front end is not transparent at all and the accuracy factors. So, physicians often reject the diagnosis reports generated by this system and follow the traditional methods like visual inspection or manual comparison with standard waveform. So, the precise arrangement of automated ECG diagnosis (AED) system can not only reduce the physician's labor, but also can assist in complicate diagnosis. Also, it may let the patients to self-study their cardiac conditions even in lethal conditions without any help of the physician. This work mainly focuses on these issues and proposes an accurate solution with pointing out the pros and cons of the system.
2. II. ECG DETAILS
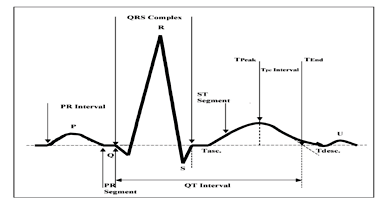
ECG is the graphic tracing of the time duration and magnitude of 3-characteristics wave peaks P, QRS, and T. P wave is the epoch related to atrial contraction. The event of ventricular contraction is represented by QRS epoch. Atrial relaxation does not produce any distinct waveform in the ECG as it is overshadowed by the following QRS wave. PQ, ST segment are two isoelectric base-line indicators [1,2]. PR interval represents the time interval between the beginning of the de-polarizations of the atrium and the ventricle respectively. The QT interval extends from the beginning of the Q wave to the end of the T wave, represents the time of ventricular contraction and re-polarization
3. STATE OF THE ART
The development of the electrocardiography was the culmination of scientific efforts aimed at improving the physiological phenomenon and the welfare of mankind [1]. Difficulties arise mainly from the huge diversity of the waveform, noises and artifacts accompanying non-stationary ECG signals. Hence, universally acceptable solution of feature extraction has not been found yet. Several QRS detection algorithms have been proposed in early eighties [3,7] mainly emphasized R spike detection by amplitude derivative approaches [8,9]. Fraden and Neuman [8] developed a QRS detection scheme where a threshold is calculated as a fraction of the peak value of the ECG. Algorithms [9][10][11] are based on the first derivative only or both first and second derivatives. Balda [10] suggested searching values exceeding the threshold in a weighted summation of the first and second derivative. Ahlstrom and Tompkins in [11] proposed that the absolute values of the first derivative would be smoothed and added with the absolute values of the second derivative. [7,13,14]. WT is proved more effective one. In 1995, Li et al. [15] used an algorithm based on finding the maxima larger than a threshold obtained from the pre-processed initial beats. Later in 1999, Kadambe et al. produced a method allocating a R peak at a point being the local maxima of several consecutive dyadic wavelet scales. In both methods, a post-processing is allowed to eliminate false R detections. Based on these two publications, a lot of researches were published on the beat detection based on the WT (Shyuand et al., 2004;Fard et al., 2007;Martinez et al., 2004;Addison, 2005;Chen et al., 2005;Chen et al., 2006) [16][17][18]. Based on the functionality, WT is categorized in sub sections, CWT, DWT; continuous and discrete. DWT is only the sampled version of CWT [19] although the choice of wavelets, scale factor, re-configurability is limited in CWT comparatively [16][17][18][19]. But, the main problem of any WT is that one has to choose the mother wavelet from a wide prototype range and the scales used to analyze the signal on an empirical basis. The mother wavelet can easily be chosen based on its characteristics and resemblance with a QRS wave, the ideal scale(s) at which the QRS are matched is harder to guess a priori [20]. All citation mentioned earlier are based on the MATLAB analysis using a dedicated tool box. MATLAB is always useful for research work as lots of built-in library functions are developing day-by-day to make it easier for end users. But, it is not at all useable in commercial software attached with a portable ECG machine. The exclusion of bulky computerized system from an ECG system is of ultimate importance which may sacrifice well-proved algorithms in research field due to the computational complexities. Hence, only thresholding based elementary algorithms are preferred to implement than any other established research patents. Responding all these motivations, authors were intended to develop acommercial software especially for the portable ECG machine. It was needed to make some trade-offs with WT based detection algorithm to make it implementable. So, the choice was limited to dyadic DWT approach and the Daubechies (DB) type wavelet families. A lot of arguments had risen between the effectiveness of two members DB4 and DB6; as both prove comparatively better in different approaches [22]. In this work, a comparative study has done and set DB4 as mother wavelet with specific scale factors. In noise reduction issue, an extra FFT-IFFT pair is engaged for further de-noising along with the popular WT tool. Feature extraction has been done here with some modification of the established algorithms of [18][19][20][21][22]. After proving the accuracy of this, MIT-BIH database is also engaged to prove the comparative accuracy and readiness of it. Wavelets may of orthogonal, orthonormal, bioorthogonal, scalar or multi-wavelet type. This work is only limited to the orthonormal dyadic type having restricted resolution of order 2 j (where j Z) i.e. a=2 j and b=2 j k. Such discrete wavelet associated with scaling functions (t) can be convolved with x(t) to produce approximation coefficients S But the input signal coefficient S 0 is of finite length N=2 M . So the range of scales that can be investigated is 0 m M. Hence a discrete approximation of the signal is written as:
4. IV. THEORY OF WAVELET TRANSFORM
Where the mean signal approximation at scale M is:
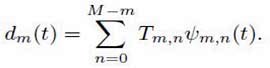
The detail signal approximation corresponding to scale m (error in approximation for finite length signal) is given by: So, the signal approximation at a specific scale is a combination of the approximation and the detail at the next lower scale.
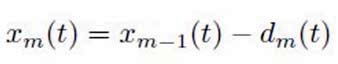
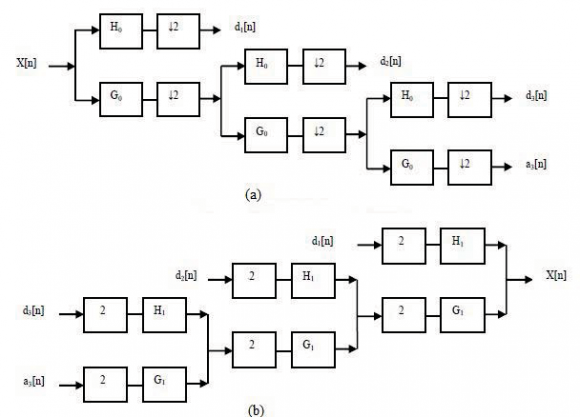
If scale m = 3 were chosen, the signal approximation is like: The iso-electric baseline (indicating the PQ & ST segment) shifting usually comes from the respiration and the electrode impedance at frequency wandering in 0.15~0.3Hz range. As it is well under 0.5Hz, it can be suppressed without disturbing the original signal. Instead of conventional high pass (digital) filter, WT is a better approach to remove the baseline wandering as it introduces no latency and less distortion than the digital filter. Here, we decompose the ECG signal into 8 levels shown in Figure4 where the set of numbers a j [n] represents the 'coarse approximation' of the signal at the resolution 2 -(j-1) & the set of numbers d j [n] represents the 'details' lost in approximating the signal at the resolution 2 -j . Thus, given a discrete time-domain signal X[n] assumed to be at the resolution 2 0 is equal to a o [n] decomposed into two sets of numbers a 1 [n] and d 1 [n]. a 1 [n] can be further divided into a 2 [n]and d 2 [n] and so on. This happens by passing X[n] through successive low pass G(w) and high pass H(w) symbolic analysis filters. At every level, filtering and sub-sampling result in doubled frequency resolution, halved time resolution and the elimination of half of the samples to adhere the Nyquist criteria. Reconstruction process is the reverse of decomposition, where the approximation, the detail coefficients at every level are up-sampled by 2 and passed through exactly matched low-pass G(w) and high pass H(w) synthesis filters and finally added as shown in Figure4. The same number of levels is taken as in the case of the decomposition. This WT principle can be used significantly in noise elimination in ECG analysis. by using DB4 prototype and reconstruct the approximation (A8) and detail (D8) signals at level 8. The DB4 prototype wavelet and the details level (D1-D8) is shown in Figure5 and Figure6 respectively. The summation of A8 and D8 will be the low frequency component of ECG signal that causes the baseline shifting. This low frequency signal is deducted from the original ECG signal to get the one excludes baseline shifting. The problem of baseline shifting is solved here by an advance filtering techniques i.e. De-trended Signal (DS) Original Signal-(A8+D8). Figure5b depicts the result of De-trending process. This filtering technique is adapted influenced by [22] where DB6 was used as mother prototype. This approach achieves 8% more SNR than the proposal in [22]. After removing baseline wander, the resulting ECG signal is now more stationary and explicit than the original one. However, some other types of noises may still affect feature extraction process. These noises may be of complex stochastic processes within a wideband, so one cannot remove them by using traditional digital filters. To remove such high frequency noises, one can efficiently use the Wavelet decomposed signal components found by earlier successive approximations. Each wavelet coefficient of those sub-bands can be modified by applying a threshold function & finally reconstructing the de-noised signal. This subtle approach confirms not to lose signal's sharpest features, discarding only the portions of the details that exceed a certain limit due to the occurrence of noise. Such global thresholding option is derived from Donoho-Johnstone fixed-form thresholding strategy for an unscaled white noise [22]. Hence, the lower details are removed from the original and the high frequency components are vitiated.
In this work, lower details D1, D2 are removed and the signal becomes smoother and noise disappears since noises are marked by high frequency components picked up along QRS complex identification is the most important segment of any ECG feature extraction algorithm. The efficiency of total algorithm largely depends on the accuracy of this module. The R peaks have the largest amplitude among all, allowing them the easiest way to detect and good reference points for farther detections. In this study, for detecting R-waves, the benefits of WT are utilized intelligently. Only details up to the level D6 are kept for QRS complex detection and all the rest are discarded. By observing the average amplitudes of the R-waves, 30% of the maximum value is being set initially as the threshold level (T). any upward excursion that exceeds the T is taken as an Rwave otherwise termed as noise. Thus, by calculating two slope values, one upward & one downward, an Rwave can be detected. Consecutive R-waves are detected using the same technique and noise peaks are eliminated. The detection of the QRS complex is being done from identified R peaks based on modulus maxima [21][22]. The Q and S point occurs about the R Peak with in 0.15second. The left point denotes the Q point and the right one signify the S point. Calculating the distance from zero point or close to zero on the left side of R Peak within the threshold limit denotes the presence of Q point. Similarly the S point comes from the right hand detection [Figure9]. This is the most convenient way to measure those peaks and their derivatives.
ii. P and T wave detection P wave is detected from filtered and de-noising ECG signal using the method "Length-Amplitude-Slope" introduced by [20]. To determine P wave amplitude, slope, starting point, destination and forms, the fourth scale WT information is employed here. Fourth scale is chosen based on energy analysis of P wave in ECG signal and the impact of baseline drift. This method is only possible if QRS detection and interval calculation is done correctly. Employing a threshold amplitude, P wave is searched in RR interval. RR and PR standard intervals are 0.6-1.0s and 0.12-0.20s respectively. It is assumed that this is a P peak in every 0.40s before the identified R spike. Then applying a threshold value of 30% of the standard value 0.25mV, all detected maxima points are leveled as P wave. Also the instantaneous P-R and P-P intervals are measured accordingly. After detecting P-wave and QRS-complex, "Curve Length Transform" described in [19] is followed as T-wave detection algorithm. The details are omitted here. Summarizing all the steps, outcome of the complete feature extraction method is shown in Figure10. needed a graphical user interface (GUI) with an input segment to provide the raw ECG signal and a separate report generation section. Being motivated by this, arule based architecture is designed based on the well known "Water Fall Method" of software development with the following steps: system requirement, system design, implementation & the verification. This system will extract the characteristic feature of ECG signal with the comparison of predefined standard parameters and predict the diagnosis based on abnormalities found on that The user interface form, termed as "Main Form" is designed for the end-user or physician. It contains three menus named "Setup", Task" and "Exit". "Setup" tab is to set the standard amplitude and duration values for three categorized patients: male, female & children in separated forms named "Normal Amplitude" & "Normal Duration" under "Normal Amplitude Setup" and "Normal Duration Setup" sub-menus of "Setup" menu [Figure11].
The total information of the deviation of standard parameters for any specific disease is needed to input in the "Abnormalities" form through the "Abnormalities
Setup" sub-menu under the "Setup" menu. For an instance, Hypocalcaemia, a heart disease has deviations mainly in ST segment with the prolonged QT specified by the physicians. These syndromes are stored in the attached SQL server 2008 database in the process schematically shown in Figure12. These procedures are repeated many times to store all the deviations [Table2].
b) Core/ Processing Unit
The standard values and disease syndromes being input on "Normal Duration", "Normal Amplitude", "Abnormalities" forms are being stored in tables "Wave Standard Duration", "Wave Standard Amplitude", "Abnormalities Symptom Data" respectively in "ECG Analytical Soft DB" database. Another table, "Patient" is reserved for storing patient personal information attached with his/her ECG (.xml) file. The Relational Database schema is shown in Figure13. This userfriendly system is developed in .net framework using C# language. The characteristic features being extracted using De-noising, De-trending, WT, FFT-IFFT pair techniques, will be stored in "Patient Real Data info" The fields of this table will be compared with the standard values and abnormalities stored earlier and will generate a probabilistic diagnosis based on this ruled based architecture. Thus "Comparison Result" table will be filled on and to display in report generation unit. c) Report Generation and Case Study "Task" menu containing "ECG Analysis" and "ECG Signals" sub-menu in the "Main Form" is the report generation section where to recognize/ browse the given ECG log file (.xml format) with patient details. Extracted characteristic features from all 12-leads will be displayed in tabular format with probabilistic diagnosis in "ECG Analysis" form Figure14. Again, in some analysis purposes, sometimes it is necessary for physicians to have visual representation of ECG waveform than to have the measured characteristic value, may be 12-lead graph all-together for comparison. "ECG Signals" form is designed (Figure15) for this purpose with the scales are in millisecond and millivolt in time & amplitude axis respectively.
5. VII. ANALYSIS
To analysis the performance of the proposed system, it was needed the noise simulated raw ECG signal and the real life ECG data. Using advanced signal processing toolkit (ASPT) in Lab VIEW (Laboratory Virtual Instrument Engineering Workbench)-2009, the low noise ECG signal (used in earlier analysis) and the raw waveform from MIT-BIH Arrhythmia database are simulated by mixing different types of noises (Figure13). For the performance analysis of the proposed software, a series of raw ECG log files with the diagnosis report by their system has been collected from the Department of Biomedical Engineering, University of Dhaka. Table4 shows the comparisons with the proposed system developed in SectionVI. It is obvious from these outcomes that the diagnosis reports generated by the proposed algorithm are quite similar to the diagnosis report collected from the reference system with only 10% variation. The functionality of this software has also being checked by a physician. The proposed algorithm obtains an average sensitivity rate of 93.7% and average error rate below 8% after analyzing 25 records. To our knowledge, only the R spike detectors based on Li's algorithm [15] obtained the comparable results with sensitivity between 99.7% and 99.9%. However, that algorithm makes use of several heuristic rules and requires the setting of many empirical parameters. Here the proposed algorithm achieves comparable performances with a simple non-parametric thresholding method and without any need of advanced post processing stage comparing to that article. Also, the presented the software implementation of this algorithm proves that the accurate diagnosis is always satisfactory utilizing this detection logic.
6. IX. CONCLUSION AND FUTURE WORK
The large variety of ECG feature extraction algorithms and the continuous efforts for their enhancement proves that universally acceptable solution has not been found yet. In this study, emphasizing on wavelet thresholding, relevant noise removal and utilization of simple detection logic for the ECG characteristics detection is present. A robust and efficient tool for fast, less complex practical software is also provided that can be interfaced efficiently with commercial ECG machines. The complete verification of the proposed software can lead a massive utilization in even rural areas where the presence of the physicians is not so available. The day-by-day improvement in Biomedical field demands the comprehensive update of the software's database to include the miniature researches. And the more attractive feature could have been

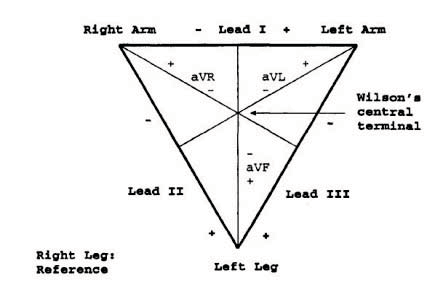
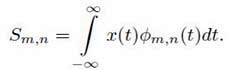
![Figure 3 : Einthoven's triangle and the axes of the six ECG leads formed by using four limb leads [3] III.](https://engineeringresearch.org/index.php/GJRE/article/download/100363/version/100363/6-Design-and-Implementation_html/7680/image-4.png)
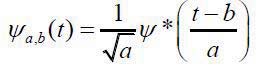
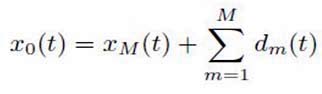
![Transform process the same data at different scales or resolutions with assigned ranges of frequencies at every scale component [69-72]. The continuous wavelet transformation (CWT) of a signal f(t) is given by the convolution integral of f(t) with the time inverted and scaled wavelet function (t). (t) should have specified properties like zero mean, non-zero finite energy function. From a mother wavelet function, one can obtain a family of time-scale waveforms (daughter wavelet) by translation and scaling like: Where, * denotes complex conjugation, a represents dilation factor (a > 0), b the translation with a, b R. Mother wavelet is defined for a = 1 & b = 0. The key selection criterion of a good mother wavelet is its ability to fully reconstruct the signal from its decompositions. Depending on a, (t) compresses or dilates which allows WT to extract high and low frequency components of the signal. Small a let (t) to contract in time domain and the frequency response of the wavelet to shift in the higher frequencies, thus fine details or fast oscillations of the signal can be extracted. Similarly, more global signal properties and low frequency oscillations of the signal are possible to extract using larger a. The discrete wavelet transform (DWT) is the discrete counterpart of CWT where a, b are usually discretized with significant reduction of computational time. DWT of a function x(t) L 2 (R) can be written as a projection of this function on the predefined wavelet basis, let { m,n (t)}: For each scale m, the wavelet coefficients T m,n are signals that represent the matching degree between wavelet m,n (t) and the analyzed function x(t) depending on location of n.](https://engineeringresearch.org/index.php/GJRE/article/download/100363/version/100363/6-Design-and-Implementation_html/7682/image-6.png)
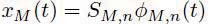
![Design and Implementation of a Real-Time Automated ECG Diagnosis (Aed) System 2 44 Corresponds to the successive stripping of high frequency information d m (t) from the original signal at each step, this is referred to as multi-resolution analysis of a signal using Wavelet Transform and is the basis of this work. Such decomposition/reconstruction can be shown as modified filter bank tree named Mallat algorithm [20] or Mallat Tree Decomposition (MTD)](https://engineeringresearch.org/index.php/GJRE/article/download/100363/version/100363/6-Design-and-Implementation_html/7684/image-8.png)

| using reference MIT-BIH Database | ||||
| Record | Total | Detected | Sensitivity | Accuracy |
| No. | Beats | Beats TP | (%) | (%) |
| 100 | 2273 | 2172 | 89.96 | 11.04 |
| 101 | 1865 | 1864 | 93.12 | 6.88 |
| 102 | 2179 | 2100 | 92.15 | 7.75 |
| 103 | 2078 | 2123 | 94.52 | 5.48 |
| 105 | 2543 | 2633 | 91.86 | 8.14 |
| 107 | 2124 | 2088 | 92.35 | 7.65 |
| 108 | 1775 | 1864 | 93.49 | 6.51 |
| 109 | 2530 | 2520 | 89.67 | 10.33 |
| 115 | 1953 | 1825 | 90.23 | 9.77 |
| 118 | 2278 | 2187 | 94.56 | 5.44 |
| 119 | 1987 | 1768 | 95.16 | 4.84 |
| 124 | 1473 | 1366 | 89.65 | 10.35 |
| 200 | 2601 | 2806 | 90.12 | 9.88 |
| Case 1 | Case 2 | Case 3 | ||||
| ECG | This | Ref. | This | Ref. | This | Ref. |
| Features | system | system | system | system | system | system |
| P-int | 10ms | 12ms | 15ms | 20ms | 10ms | 15ms |
| QRS-int 10ms 14ms 20 ms 18 ms 15ms 20ms | ||||||
| T-int | 15ms | 16ms 35 ms 30 ms 40ms | 42ms | |||
| PQ-int | 20ms | 23ms 15 ms 18 ms 15ms | 19ms | |||
| QT-int | 45ms | 40ms 30 ms 35 ms 35ms | 32ms | |||
| PR-int | 20ms | 15ms 15 ms 20 ms 16ms | 15ms | |||
| ST-int | 40ms | 38ms 20 ms 22 ms 25ms | 28ms | |||