1.
he search for differentiated products and for better cost has accelerated the reduction of product life in the market, made people rethink product design and create platforms and strategies. That context creates a new challenge to companies, that is, to get competitive advantage generated by earlier launching of new products to the market. In this strategy, companies need to reduce the number of direct competitors and to avoid price erosion, traditional in a competitive market. Having that differentiation and using it by making products available to the market before competitors do is the strategically objective of most of the companies inserted in this context. Earlier availability of a product to the market may increase the profitability of a company due to the extension of its sales life, and also to the qualification of their product development (NPD) area to launch products within the timing required by the market. Fast development of a product leads to superior performance according to empirical studies (Mascitelli, 2006); (Bascle et al, 2012); (Shankar et al., 2013).
Time to market (TtM) expresses the speed a company moves from the concept of a product to initial market sales. The time to market (TtM) is defined as the total development time of a new product. It is obtained by adding the concept generation time (Tcet) to the conversion time (drawings/prototypes/tests) and to the execution time (moulds and tools execution) (Whirlpool, 2012). To Mascitelli (2006), in the past, the TtM was less important than innovation and the cost of new products. However, in the last decade, speed and efficiency have been considered to be at the same level of priority as price and cost. Actually, today, many companies clearly know the difference in the total profit generated by being the first to launch a product. Although many companies use the fast follower strategy for a product already launched in the market, one should observe that an excellent TtM usually offers profitability gains for having a differentiated product before their competitors. Given the above scenario, and looking for that strategic advantage, there is a concern that the development lead time of a new product may be affected in its initial concept generation phase due to the uncertainties experienced by the project team regarding the new product. One of the well known factors about the development process of a product is that the degree of uncertainty in the beginning of the process is very high, decreasing with time (see figure 1). However, most of the constructive solutions are chosen at the beginning. Decisions among alternatives at the beginning of the development cycle are responsible for 85% of the end product cost. Modification costs increase along the development cycle as every change may invalidate a greater number of decisions already made (Rozenfeld et al, 2006).
This work uses the new product development model called C2C to demonstrate the uncertainty level along the stagedgates (Whirlpool, 2012). The figure 1 shows the project phases and the uncertainty level associated. The conceptualization phase is the momentum of the project that the uncertainties are in the highest level. This is the phase that the project team is selecting the concept for a new product. Also picture 1 show the tollgates: IST or Idea Selection tollgate when the
T Global Journal of Researches in Engineering XIII Issue v v v V Version IConcept Evaluation tollgate when the final concept of the new product is defined and locked, BET or Business Evaluation tollgate when the investments are approved for tooling execution and finally LCT or Launching Tollgate when the product is approved to produce and commercialize.
Figure 1 : Uncertainty level along the project phases Smith and Reinertsen (1997) calls fuzzy front end the initial development phase or the new product concept generation phase, mentioning the lack of attention of managers to that initial phase as it does not have the traditional management control, that is, neither time scale nor established goals. Therefore, it is not possible to detect whether actions are deviating from the plan in the fuzzy front end. Also, the lack of controlling mechanisms is aggravated by the fact that most managers only pay partial attention to that phase. As managers are more involved with finances, they tend to ignore that phase as it seems to have a fuzzy financial impact. In view of what has been exposed, the present paper proposes to identify the main uncertainties within the fuzzy front end, and to determine the weight of factors that define the product concept generation time during the fuzzy front end and the time to market, that is, which variables shall be early identified to avoid delays to the concept generation time (Tcet) and to the time to market (TtM).
The article is divided into five sections. The second section, which follows this introduction, is devoted to a literature review on TtM. The third section describes the proposed model. This section begins by addressing the conceptualization of a new product as the focus of this study. A research within the NPD of a home appliance industry is made to identify the main critical factors (uncertainties) in the fuzzy front end phase. The critical factors identified help to create the theoretical construct. This section ends with the presentation of the proposed model. In the fourth section, a case study is made inside the same NPD with two purposes: to validate the critical factors identified in the previous research and to understand the influence of the uncertainties on the TtM of the projects developed in these NPD. Also empiric data are analyzed through the use of linear regression to probabilistically determine concept generation times (Tcet) and the time tomarket (TtM). The fifth section of the study shows the results, limitations and implications.
Some authors (Montoya-Weiss and Tatikonda, 2001, Eisenhardt and Tabrizi, 1995; Song and Montoya -Weiss, 2001, Kerzner, 2003) reported in their study, concerns with excessive changes during the development of a product as well as the impact of new developments in technology and marketing and its effect on the design of a new product. Crawford (1994) highlighted that imperceptible costs may be generated due to acceleration in NPD to ensure rapid development. These costs include errors resulting from unfulfilled milestones, risks related to non-dominated technology and marketing uncertainties on the designing of the product to be developed on account of the pressure regarding speed in development. Datar et al. (1996) reports that the excess of information on consumers may create confusion and subsequent duplication of effort by the project team that may cause impairment of TtM. Cooper and Kleinschmidt (1995) Brown and Eisenhardt (1995) the main factors affecting the performance of the PDP are: the project team, the project leader, the role of the managers and the involvement of suppliers and customers during project execution. In the research made about which approach is given by product development reference models to the fuzzy front end of a new project showed that the main decisions and commitments are made in the initial stage, when the concept of a new product is generated. Future corrections to a decision made may imply in launching delays due to reprocesses.
The identification of the variables of research starts by examining the product development process as shown in Figure 2. . For this study we will be considering only the design or conception stage for the formulation of the forecasting model. The conversion and execution phases of this study will be considered as dependent on the design phase and predictabilities. That is, it is understood that the expected results for these two phases depend more on the excellence of its execution and standardization of procedures. This is on the principle that the critical factors are inherent in the early stages of conception, since this is the stage where there is a greater lack of accurate information for the project team, therefore this phase becomes critical for defining TtM. Since TtM (ideal or standard) = st1 + st2 + st3, but taking into account the actual time we can write the equation as follows:
Each ? has its own characteristics depending on the activity to be performed within the project phases within the NPD. As mentioned earlier in this chapter only the variations inherent in the design phase or t1 will be considered in this study. It is understood that the definition, knowledge and management of critical success factors of the project in the early stages of new product conceptualization will assist the project team in meeting the deadlines. Failure to comply with the schedule or delay in launching a new product is linked to the lack of knowledge of critical success factors.
Below some examples of traditional delays and impact on TM described by Smith and Reinertsen (1997), Chen et al. (2012) and Griffin (1997) are cited:
? Delays due to the understanding of the project problem, or level of complexity of the project. In this case the project team does not have the usual experience in developing tasks.
? Delays due to unknown mental processes of generating or creating solution. In this case there is training in order to solve problems related to the activities.
? Delays in decision making, the need to "hit the gavel"
for the delivery of results. The latter can be defined in two ways, the first being when the information requested or required for a definition does not reach the project team, and the second when the information arriving to the project team is incomplete or inaccurate.
a) Identification of project uncertainties in the fuzzy frontend of home appliance sector
As a continuation of this study we propose a complementary study to identify the critical success factors in the new product project performance. This research aims at identifying specific critical factors on the particulars of a given NPD. To better understand the reality existing in a project environment subjected to the pressures of a competitive market, we chose to interview a group of people who work in the NDP of a large multinational company leader in the sector of household appliances in Brazil. The target of the research consists solely of experts and project leaders with extensive experience in new product development. Therefore, in this study, we used intentional sampling, by selecting a group of 15 professionals having a cumulative experience of 10 to 25 years on projects. The objective was to identify the main insights of these experts regarding the causes and factors causing delays in the project (for refrigerators, washer machines, free standing ranges, room air conditioners and micro-wave ovens) that are compromising TtM on the last 10 years. This is on the assumption that the public interviewed has enough skill and competence to perform a specific task of the project within the stipulated time, as long as provided with the adequate means for its execution. The questions asked were: ? What does the word "doubt" represent at the beginning of a project?
? What is your view on the complexity involved at the beginning of a project? ? What are the main uncertainties involved at the beginning of a project?
? What affects the speed of development of a project conception?
The first part of this research involved collecting data through survey sent over the Internet where we obtained the answers (written). With the answers provided by the project leaders (experts), we synthesized and classified them by clusters with common factors (see figure 3). The definition of the critical success factors of a project in NPD is obtained from the correlation of data from field research conducted with the theoretical framework on TtM.
2. b) Theoretical Construct
To quantify the impact of the critical success factors of a project on project performance it is important to show the relationship between information, uncertainty and project performance (TtM). Figure 4 shows the theoretical construct proposed to solve the problem showing the relationship between input factors, middle factors (in this case the critical success factors) and output factors. -What will be the final performance of the product and whether it will be approved -Aesthetics developed after the deadline, losing the launch date.
3. CLUSTER 2: MARKETING PROFICIENCY
-Scope changes in the initial proposal, generate rework and delay in the launch.
-Uncertainties cause loss of resources focus and generate rework causing launch delays.
-Non availability of information at the right time leads to delays in delivery of tasks and consequent delay in the TtM -How to address the unresolved requirements as well as wide and constant variation on project objectives.
-In answers to be provided due to the lack and/or little information.
-If the marketing briefing was complete.
4. CLUSTER 3: CONCURRENT ENGINEERING
-Regarding the commitment of the functional areas in providing the best resources for the project.
-If all areas involved in the project are aligned with the end goal.
-What will be the team's commitment to the challenges of the project.
-Who can we count on for the project (competence and ownership).
5. CLUSTER 4: CONSUMER TRANSLATION TO PRODUCT AND PROCESS SPECIFICATION
-How to transform the consumer's desires into product specification -What are the benefits to be delivered to the consumer that reflect a winning product.
-How to meet cost and final quality goals for the product.
-What will the product's final performance be and whether it will be approved.
-Delivery of the project goals without generating overestimation of investments, budgeting etc.
-How to address unresolved requirements as well as wide and constant variation on project objectives.
-Regarding the understanding of cost, quality and innovation goals to be made available in the project.
6. CLUSTER 5: RESOURCES ALLOCATION
-Who can we count on for the project (competence and ownership).
-Lack of resources creates delays.
-If the investment in the new project will be approved throughout development.
CLUSTER 6: TECHNICAL SKILLS -How to transform the consumer's desires into product specification.
-What will the product's final performance be and whether it will be approved.
-Lack of competence of project team members generates delays in carrying out tasks.
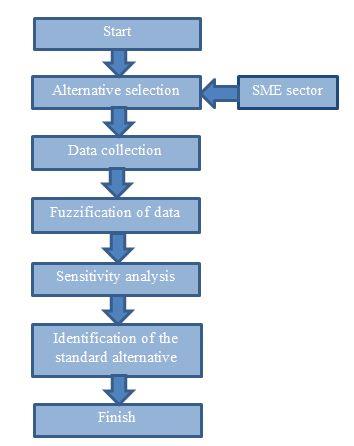
-Delay in reconciling project demands (marketing, cost, quality and legal requirement) generates delays in the TtM. It presents a whole series of steps that should be implemented for the identification and formatting of data. This formatting is for the purpose of carrying out the simulation of TtM for a given project. This simulation will allow the project group an understanding of the likelihood of this project being launched within the estimated TtM.
Step 1 begins with the formation of the team that will work throughout the process of determining TtM. It is desirable
7. d) Modeling Tools Employed
The linear regression analysis through software JMP/Anova (2011) is used to quantify the impact of each variable on the project development time, and then to obtain a general equation that represents the impact of a set of variables on the total time of product development.
To check whether the result of the TtM simulation presented good adherence to the reality of the project environment, the simulation results were confronted with the actual data obtained from the projects already carried out by the researched company. Data and records of 15 projects carried out by the company were collected by means of workshops with project leaders (specialists). A set with the same leaders was also carried out to assess the impact of each variable (uncertainty) on the projects researched. The purpose was to check whether the simulated results were coherent with those found in the records of the finished projects, and to ensure the precision of the models chosen to estimate projects TtM.
The field study involved the NPD of the home appliance industry. In this study, a survey was conducted with the senior project leaders. They answered a questionnaire sent via internet with questions about projects already undertaken. The approach applied was to understand the influence of the critical success factors on projects delivered and also to validate the proposed model for new projects. The survey was conducted between February and March 2012. The sampling profile of the NPD is reported in Table 1. To apply the linear regression, a study of the main projects carried out by the researched company, leader in the segment of home appliances, is suggested. This research resulted in a sample of 15 projects already carried out in the four main businesses of the researched company. The seven factors (uncertainties), present in the fuzzy front end of a project, identified by the specialists as those that impact the most the TtM, comprise the group of variables x knowing the uncertainties (x), a workshop with those specialists (project leaders) was carried out to individually attribute the degree of impact of each variable on the product concept generation phase (Tcet) and on the time to market TtM (Y) in each of the projects developed by the team. This paper used a more intuitive approach in the evaluation of the results over more objective variables. The critical factors were deployed through specific questions and where the final averages were obtained.
8. b) Results Found
The normal probability graph shown in figure 6 identifies the most significant uncertainties after the analysis of variance (ANOVA), that is, the uncertainties that are further away from the diagonal straight line, those that have the greatest significance or impact on Tcet and TtM. This analysis can be confirmed with the Pareto plot represented in figure 4, which shows the effects of factors TDI (impact of product and/or process new technology development time within project), SCM (project scope clearness and maintenance), and FAC (functional areas commitment with project objectives) as being the most influential on Tcet and TtM. It is important to point out that variable LC (leader competence as a manager G experienced in leading projects. The later stages of the model for determining TtM require a proven experience of these professionals for a good reading and interpretation of data. In step 2 the characterization of the project being assessed is performed. The classification should be carried out so that you can identify the particularities of the project in relation to novelty and or the complexity demanded. In step 3 a survey is conducted through a questionnaire (see Appendix 1) administered to a group of experts for the assessment of projects undertaken by the NPD study. The goal of this step is to generate sample data for subsequent simulation. In step 4 is made the simulation using the software JMP/Anova (2011) software to identify the most influent critical factors to achieve TtM. In the step 5 are analyzed the results of simulation and also defined a plan to manage the most influent variables in order to guarantee that the TtM objective will be achieved.
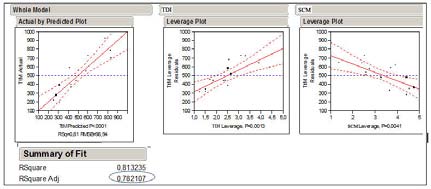
that the composition of this team be with professionals ofactivities) stood out in the product concept generation phase (Tcet) graph. The same factor is not significant for TtM, suggesting that the leader capability at that point of the project is important to manage the project team. The next step in the analysis of the results was to make a regression analysis with the most significant factors only, TDI and SCM, analyzing their residues and generating a model (equation). In the graphs shown in figure 7, the value of Rsquare adj shows that these factors (TDI and SCM) represent 78.21% of the variation found in the data, a value greater than when factor FAC is added (variation = 74.75%). The analysis of variance shows that the probability of such factors to happen at random is of 0.01%. As a result, it becomes clear that thetwo uncertainties (TDI and SCM) were the most significant to influence Tcet and TtM.
9. d) Prevision Model Validation
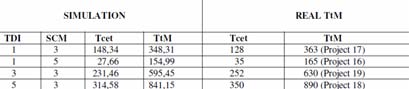
The validation of the model was done for 4 projects that were not involved on the case study. The table 2 shows the previewed TtM obtained through the use of the equation (1). The table 2 also shows the real TtM occurred by project. The comparison between previewed TtM and real TtM expresses the accuracy of the model. The score used to simulate TtM comes from an interview conduct with project team members. The project team members attributed scores to TDI and SCM in according with: not satisfactory (1) -little satisfactory (2) -satisfactory with minor restrictions (3) -satisfactory (4) -above expected (5).
10. Table 2 : Methodology validation for new projects
The case study shows that the evaluated NPD should be concerned with prior identification, development and certification of new technologies to be introduced in their appliances (e.g.: Refrigerators, Washing Machines and Ranges) once the lack of knowhow about those factors in terms of product and/or process has generated delays to the latest launchings. The NPD need to take care about product or process innovation for new products that are not tested and certified before the conceptualization phase in order to avoid delays on TtM. Another finding that caused delays on project launching is regarding the "non-maintenance" of the original proposal of the new product along the project. In other words, the briefing generated by marketing has not been consistent, being changed during the development of the project, leading to process re-loops and launching delays. Although, all uncertainty factors are present within (NPD), the simulation evidences shows greater concern with (TDI) and (SCM) in the projects to come as they have the most impact on the projects launched in the last years. The prevision model was validated with projects that not participated on the case study. The simulation presented results very near with the reality. The comparison between the simulated results with the practical results shows 5 to 10% of error. This level of error is quite acceptable with respect to TtM variation. It means that the prevision model is adequate to preview the TtM .The NPD participant in G the sampling followed the boundary conditions or limitations of the model for this evaluation. As boundary conditions for this study we established that NPD assessed should possess: -a project leader appointed at the beginning of the project, managing the team project until the release of the product, -a reference model of product development with staged-gates defined, -the application of simultaneous engineering practices; -NPD maturity on new product development,project team having previous experience of over 5 years -strong technological base.122 Finally the results of this study suggest that the development time performance of new products is linked with complex set of variables and the lack of understanding and management of these variables during the conceptualization of a new product may affect the development time performance of a new product. This research could be extended and expanded in several ways -for example by studying other models of NPD in companies of Different branches.